Businesses set revenue targets, stock levels, and hiring plans around their forecasts. When a forecast misses, targets get reset, plans get redone, and leadership stops trusting the numbers.
In August, we released research on combining models for business forecasts instead of betting on one. It found that an ensemble cuts those misses: fewer misses against plan, far fewer bad quarters, and forecasts teams can rely on from day one.
Today we’re putting everything behind that work on GitHub: the data, every forecast, and the code that scores them. Your team can rerun the analysis, check our numbers, and test its own approach against the same benchmark.
Why picking one model leads to missed forecasts
Forecasts shape budget allocation across a business. Executives sign off on them, but they rarely get to see which model produced the forecasted number or what its track record looks like.
The usual approach is to test a handful of models, pick a winner, and stick with it. That works until the winner changes, and it changes often. There’s no way to know ahead of time which model will hold up next quarter.
A wrong pick doesn’t show up right away. It shows up later, when results land well off the forecast and the plan has to be redone. After a few of those, people stop trusting the numbers.
How combining models cuts the misses
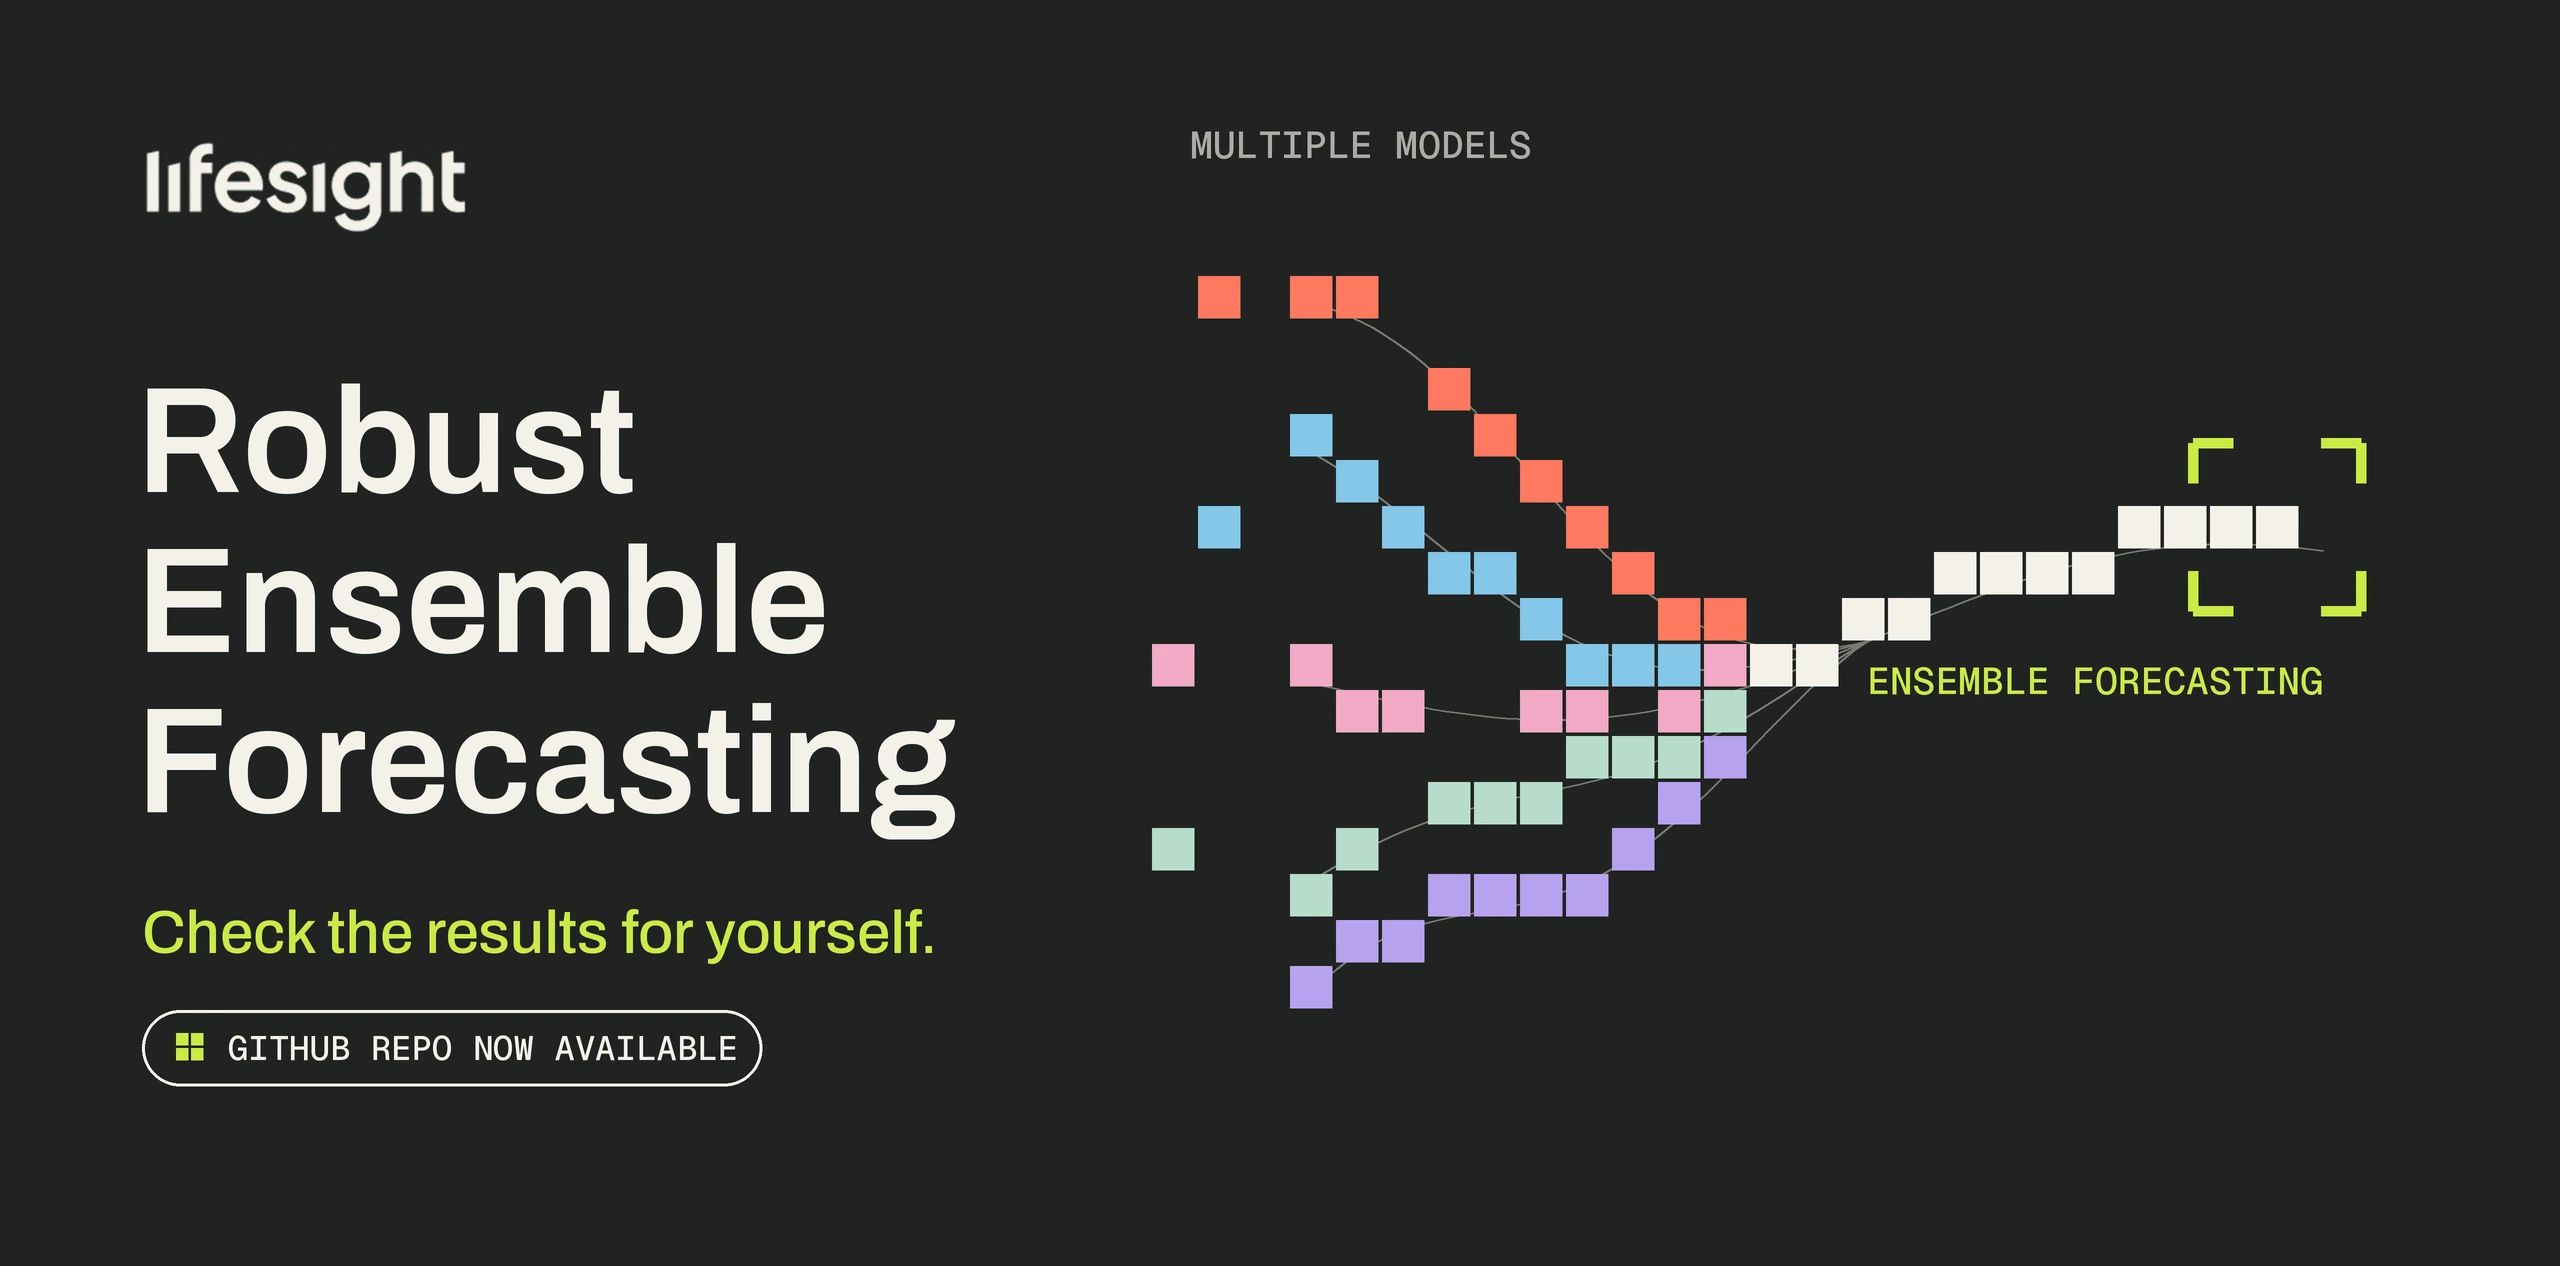
An ensemble takes a different route. It runs several models and averages their forecasts. Models tend to miss in different directions at different times, so the average lands closer to what actually happens.
In our earlier research, every ensemble we tested beat the best individual model or tied with it. You also don’t need to know in advance which model is best.
We wanted anyone to be able to check that result for themselves. So we’ve published everything behind it on GitHub .
What fewer misses look like in the data
These are the results you can now check for yourself.
No model stays on top: No single model was best more than about a third of the time, and the rankings kept shifting from one forecast origin to the next.
An ensemble matches the best pick: It did as well as picking the strongest model and using it everywhere, without having to know which model that is. Against picking a model per series, it came out ahead in every vertical we tested.
Smaller misses against plan: It gave up the least accuracy compared with the best model available, on typical forecasts and on the worst ones.
Works from the first forecast: There’s no ranking to learn, so it’s useful from day one. That helps most when you have little history to go on.
Fewer bad quarters: A well-chosen single model won outright slightly more often. It also finished near the bottom far more often. The ensemble gives up a few wins in exchange for far fewer bad quarters.
Verify, test, and build on the results
Every finding above comes from files in the repository. Here’s what’s inside and what you can do with it.
Start with real commercial data: The package has 99 daily series from 65 organisations in 13 verticals, covering July 2019 to June 2024. Each series has daily purchases alongside daily Google, Meta, and TikTok spend.
See where each model missed: Alongside that data are day-by-day forecasts from all five models (Prophet, CatBoost, SARIMAX, NeuralProphet, and a Bayesian model built in PyMC) across 293 backtest windows. The ensemble forecasts and the actuals sit next to them, so you can compare every miss side by side.
Rerun every result with one script: Because the forecasts are already published, there are no models to retrain. One script turns them into all seven tables, all ten figures, and every statistic in the paper.
Get the same numbers we did: Random seeds are fixed, so your confidence intervals match ours every time. A built-in check then compares your output with ours. Across machines, results match to nine significant figures, well beyond the three the paper reports.
Benchmark your own approach: Once your numbers match ours, you can test your own. The train, validation, and test windows for every series are included. You can score a new model, or a new way of combining them, on the same data and splits.
Reuse and cite it: Whatever you build, you’re free to share it. Everything is open under CC BY 4.0, with an MIT option for the code. The release is archived on Zenodo with a permanent DOI, so citations stay valid as the repository changes.
Who gets the most out of it
Data science and analytics teams: Compare your model selection process with a published baseline. If you pick a model per series today, you can see what that may be costing you in accuracy.
Marketing, finance, and planning leaders: Ask your team how your forecasts are chosen. The findings are useful even if you never open the code, and your team can check them for you.
Researchers and educators: Use it as a teaching set or a benchmark. It’s a real, multi-vertical panel of advertiser data, and every number can be traced.
Check the results yourself in three steps
- Get the code. Clone the repository and install the requirements in a fresh Python environment.
- Run the analysis.
run_all.shregenerates every table and figure in the paper. - Compare with ours.
verify.pychecks your results against the published ones and reports any differences.
The README lists which script produces each table and figure, so you can also run only the parts you need.
Every number traceable to its source
The series, every model’s forecasts, the scored results, the code, the figures, and the paper all sit in one repository. You can trace any number back to the file and script it came from.
Built on public data: The series come from a public marketing-mix dataset of ecommerce brands. We kept only series with long histories and near-complete spend data, so the panel leans toward larger advertisers. With messier data, picking the right single model gets even harder, which strengthens the case for an ensemble.
No personal data: Organisations appear only under the anonymized IDs from the source dataset. None are named.
The forecasts are the reference: We produced the forecasts with a pre-release version of Horizon, our open-source forecasting library. Horizon 1.0 has changed since then, so rerunning the models today won’t give identical forecasts. That’s why we published the forecasts themselves, as the inputs to check the paper against.
Bring ensemble forecasting into your own workflow
We’re sharing more of the methods behind Lifesight’s measurement platform in the open. Horizon includes the same model families and combination logic we tested, so your team can use ensemble forecasting in its own work.
Scientifically reviewed
This work has been reviewed by our independent Scientific Advisory Council, a panel of experts who assess our research separately from our product teams.
To explore the data and check the results yourself, head to the repository.
View the repository on GitHub →
For the full method and results, you can also read the paper here.