As marketing grows more complex and privacy regulations tighten, brands are rethinking how they measure campaign impact. Traditional attribution models, once the industry’s go-to solution, are increasingly unreliable due to signal loss and platform biases. Enter geo-based incrementality testing: a privacy-safe, channel-agnostic method that isolates the true causal impact of advertising by comparing test and control regions.
This article breaks down how it works, why it’s gaining momentum, and how leading brands are using it to drive smarter, ROI-focused decisions.
Read More About: What is Incrementality Testing? A Guide for Marketers
What Is Geo‑Based Incrementality Testing?
Geo-based incrementality testing is a method of measuring the true impact of advertising by dividing audiences into geographic regions designated as test and control groups. The treatment is done in the test regions, while control regions are kept business-as-usual (BAU). Comparing sales between these two groups reveals the true incremental impact of advertising across any channel where impressions can be geographically controlled.
Use‑Cases and Case Studies of Geo‑Based Incrementality Testing
1. Grocery Chain Reallocates Ineffective Paid Search Budget After Geo-Test Confirms Zero Incrementality
A major grocery chain conducted a geo-based holdout test, pausing all of its non-branded paid search campaigns in 12 test markets.
The experiment revealed a sales lift of 0%, confirming a lack of incrementality from the campaign. Because there was no negative lift from pausing the ads, the chain concluded the budget was redundant and immediately reallocated it to its growing CTV strategy.
2. DTC Apparel Brand Increases Revenue by 25% with Prospecting Focus
A strategic scale-up in prospecting efforts led to a 25% increase in incremental revenue for a DTC apparel brand, a result measured over eight weeks using geo-based incrementality testing.
3. CPG Brand Proves TV Ad Impact on Amazon and In-Store Sales
A consumer packaged goods brand used geo-based testing to measure the effect of TV advertising across online and offline channels.
The results showed that TV ads drove measurable lift in both Amazon sales and brick-and-mortar performance, proving cross-channel impact beyond traditional attribution models.
Why Use Geo-Based Incrementality Testing vs. Other Methods?
As traditional attribution models face growing limitations due to privacy regulations and signal loss, geo-based incrementality testing offers a more reliable, scalable, and future-proof approach to measuring true ad impact.
Here are four key reasons why it stands out:
1. Privacy-First
Geo testing does not require any personally identifiable information (PII). It relies entirely on aggregated sales or conversion data, making it a privacy-compliant approach to measurement.
2. Channel-Agnostic
This method works across a wide range of media channels, including TV, Connected TV (CTV), paid social, search, out-of-home, and even print. It provides a unified way to measure performance regardless of the platform.
3. Cookie-Proof
Geo-based testing is unaffected by iOS 14+ restrictions or the deprecation of third-party cookies. It avoids reliance on digital identifiers, making it a future-proof solution in a privacy-restricted landscape.
4. CFO-Friendly Metrics
It generates metrics that finance teams value, such as incremental ROAS (iROAS) and payback periods. These outputs provide a clear, trusted view of advertising profitability.
What are the Data & Statistical Requirements for Geo-Based Incrementality Testing?
To ensure valid, trustworthy results from a geo-based incrementality test, it’s essential to meet certain data quality and statistical design standards.
Below are the four core requirements every team should plan for:
1. Granular First-Party Sales or Conversion Data
You need access to first-party performance data, such as sales, signups, or conversions, at least at a state level. This data should be reported at a weekly or daily frequency to capture meaningful trends and support accurate modeling.
2. Pre-Test History for Baseline Modeling
Collect at least 6 months of clean historical data before the test. This baseline is essential for matching test and control geos, fitting time-series models, and estimating natural variance in your key metrics.
3. Sample Size and Statistical Power
To ensure your test results are reliable, design for at least 80% statistical power to detect your minimum detectable lift. This involves calculating the expected variance and the size of the effect you want to measure. Insufficient sample size can lead to inconclusive or misleading results.
4. Business Context and Confounder Control
Consider any known business events that could affect your results, such as seasonal promotions, holiday spikes, store openings, or overlapping media campaigns. These should be identified in advance and factored into your test design and interpretation.
How Geo-Based Incrementality Testing Works? A Step‑by‑Step Guide
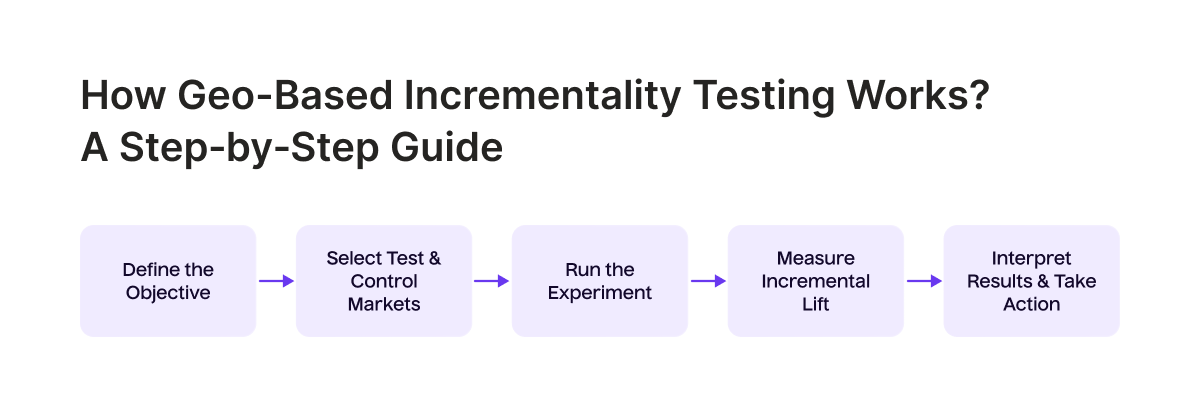
STEP 1. Define the Objective
Start by clearly identifying the goal of the test. This could be a strategic question such as:
“Does launching Google Brand Search drive incremental sales for the brand?
A precise objective ensures the test design is aligned with your broader marketing or media measurement goals.
STEP 2. Select Test and Control Markets
The process begins once the user selects the specific geographic regions for their test campaign. The system then constructs a precise, data-driven control market that is calibrated to accurately mirror the historical performance of the test regions. This creates an accurate “what if” scenario against which to measure the true campaign effect.
STEP 3. Run the Experiment
Launch your advertising campaign only in the test regions, while keeping the control regions business as usual. The test typically runs for 4 to 8 weeks, with careful monitoring to ensure correct setup, budget adherence, and no spillover effects into control areas.
STEP 4. Measure Incremental Lift
After the test period ends, compare the performance of key business metrics (such as sales, site visits, or conversions) between test and control regions. Use statistical analysis to determine whether the observed lift is statistically significant and greater than expected natural variability.
STEP 5: Interpret Results & Take Action
Use the insights to inform strategic decisions. This might include reallocating budget to high-performing channels, updating media mix models (MMM) with more accurate priors, or planning the next round of testing to validate findings across different products, channels, or regions.
How Do You Design Effective Test and Control Regions?
A well-structured test design is critical to measuring true incrementality. The goal is to maximize the signal-to-noise ratio, ensuring that any measured lift is real and not the result of unrelated variability.
Here are the key factors to consider
1. Expected Lift Compared to Natural Variability
Understand how much your key metrics typically fluctuate in the absence of advertising. For instance, if weekly sales vary by approximately 5 percent, your test should be designed to detect a lift greater than that threshold. This helps ensure that the result is statistically significant.
2. Demographic and Product Alignment
Avoid including regions with unusual characteristics that could skew the results. This includes markets with unique customer demographics, distinct purchasing behaviors, or limited access to the media channel being tested. Consistency in audience and product availability across regions leads to more valid comparisons.
What are the Formulas to Calculate Geo‑Based Incremental Lift?
1. Incremental Conversions
Δ Conversions = Test Conversions – Control Conversions
2. Incremental Lift %
Lift %=(Incremental Conversions/ Counterfactual Conversions)×100
3. Incremental CPA (iCPA)
iCPA = Δ Spend / Incremental Conversions
4. Incremental ROAS (iROAS)
iROAS = AOV / iCPA
How to Implement Geo-Based Incrementality Testing for Your Marketing Campaigns?
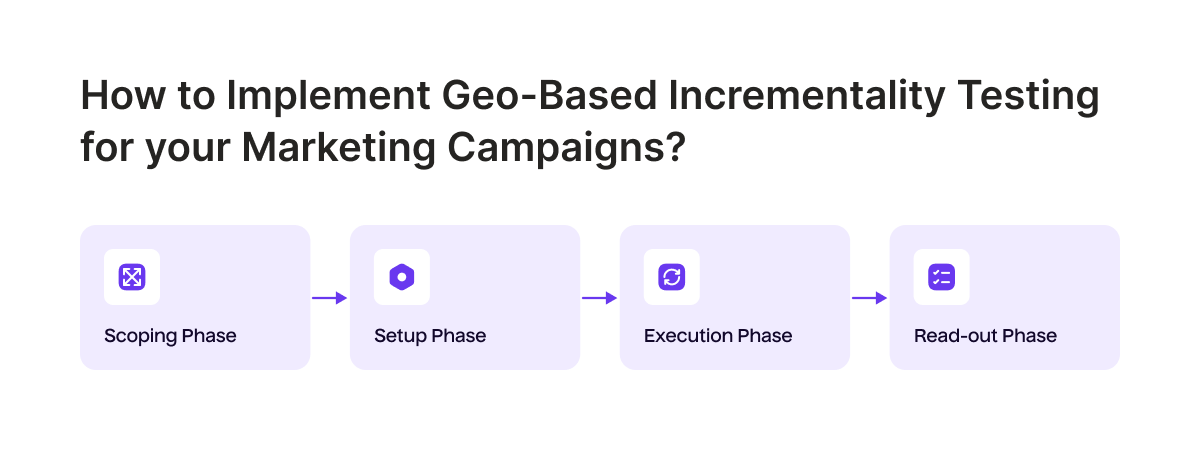
STEP 1: Scoping Phase
In this phase, the Growth Lead is responsible for setting the KPI and hypothesis, defining the budget, and establishing the lift target.
This ensures alignment on what success looks like before launching the test. The key tool used in this step is a brief template, which captures and communicates the core objectives of the experiment.
STEP 2: Setup Phase
During setup, the Media Operations and Data Engineering teams take over to tag DMAs, ingest sales feeds, and configure dashboards for performance tracking.
This technical foundation is critical for accurate measurement. Key tools include ad platform and CRM APIs or feeds, which facilitate seamless data collection and reporting.
STEP 3: Execution Phase
Once the test is live, the Marketing Science team monitors pre-trend R² values to ensure test and control regions are well aligned. They also track spend pacing and review the power meter to confirm the test is on track statistically.
The experiment monitor is the primary tool used during this phase to manage and validate the live test conditions.
STEP 4: Read-out Phase
After the test concludes, the Analytics and Finance teams calculate lift, iROAS, and payback, then summarize the results for the executive leadership team (ELT).
This phase focuses on extracting actionable insights. The key tool used is the read-out, which consolidates findings into a clear, decision-ready format.
Automating Geo-Based Incrementality Testing with Lifesight GeoLift
Lifesight’s Experiments module provides an end-to-end solution for geolift testing. It facilitates test market selection, synthesizes control markets, and actively monitors campaign execution to ensure experimental validity.
This reduces manual effort by 60 percent and cuts setup errors.
Best Tools for Geo‑Based Incrementality Testing
1. Unified Suites
These tools offer end-to-end solutions that combine Marketing Mix Modeling (MMM) with geo-based experiments. Ideal for brands looking for an integrated and streamlined testing workflow.
Best Unified Suites for geo-based incrementality testing include:
2. Open-Source Tools
These tools are free and highly customizable, giving data teams full control over experiment design, modeling, and analysis. They are best suited for organizations with in-house analytics capabilities that prefer flexibility over convenience.
Best Open-Source Tool for geo-based incrementality testing includes:
- Meta’s GeoLift ®
- Google’s CausalImpact
3. Channel-Specific Tools
These are platform-native tools built into major advertising ecosystems. They enable quick, single-channel lift measurement with minimal setup, though they often require external validation for cross-platform accuracy.
Best Channel-Specific Tools for geo-based incrementality testing include:
- Google Geo-Experiments
- Meta Conversion Lift
Pros & Cons of Geo-Based Incrementality Testing
Pros |
Cons |
| No PII; privacy‑compliant | Baseline noise can mask small lifts |
| Works across offline & online channels | Can’t pinpoint performance by creative or network |
| Validates “drag factor” & halo effects | Higher CPMs / saturation in local buys |
| Independent of platform bias | Less suitable for long‑consideration purchases |
Conclusion
Geo-based incrementality testing is the gold standard for proving causal marketing impact at scale and in a privacy-safe way. By designing statistically sound geo tests, and automating them with tools like Lifesight, brands can confidently reallocate spend toward true growth drivers and align marketing with the P&L.
Ready to prove your next marketing dollar? Explore Lifesight’s Geo-based Incrementality Testing and launch your first geo‑based incrementality test in minutes.
FAQs
1. Why choose geo testing over attribution?
Geo testing isolates causal lift without relying on cookies and avoids common attribution bias, making it a more accurate method for measuring true impact.
2. How long should a geo-based incrementality test run?
Most geo-based incrementality tests run for 4 to 8 weeks, depending on sales volume, business cycles, and the level of statistical power required.
3. What data do I need to run a geo-based incrementality test?
You’ll need weekly (or better) sales data at the DMA or postcode level, along with clean pre-test history for proper baseline modeling.
4. Can geo-based incrementality test measure offline sales?
Yes, geo-based incrementality tests can measure offline performance such as store sales, call center conversions, and POS data, as long as the outcomes are geo-tagged.
5. How do I interpret iROAS?
iROAS (incremental return on ad spend) is calculated by dividing incremental revenue by test spend. A value greater than 1 indicates the campaign was profitable.
6. Are geo-based incrementality tests expensive?
While local CPMs in geo-targeted tests can be higher, the ability to identify and eliminate wasted spend often offsets the added cost.
7. How does Lifesight help with geo-based incrementality tests?
Lifesight simplifies the process with one-click DMA matching, real-time lift dashboards, and integration with Marketing Mix Modeling (MMM) tools.
You may also like


Essential resources for your success