It is without question that social media has exponentially transformed the global digital landscape in the modern era. With our latest in-depth study, we have encapsulated this profound evolution from 2020 to 2025, which saw the largest rise in visits to social media platforms.
By utilizing SEMrush’s robust analytics, we’ve scrutinized the meteoric rise in social media visits, which peaked at an astonishing 5.41 billion active users in 2025, marking a massive 85% growth over five years that has never been seen before.
Our research highlights the supremacy of platforms like Facebook, YouTube, and WhatsApp, with Facebook maintaining 3.07 billion in 2025, undoubtedly due to its continued dominance across global markets. Meanwhile, TikTok’s growth to 1.94 billion users incorporates the rapid change of this digital change.
The United States, India, and Brazil emerged as the top visiting countries, showcasing the extensive reach of social media across continents, making this a global phenomenon where nearly everyone is connected.
Through our insightful lens, we reveal key findings such as a mobile-dominant user base with 98% accessing platforms via mobile devices, reflecting the shift towards modern connectivity.
This study is an important gateway and will give you a vital understanding of the current state and future trajectory of social media’s towering influence in the modern age.
Key Findings
- Five-Year Growth: Social media visits jumped from 2.95B to 5.41B, an 83.4% increase over five years from 2020 to 2025.
- 2025 Visit Highs: Global social media users reached a record high of 5.41 billion in 2025, representing 68.5% of the world’s total population, with an average of 143 minutes daily usage.
- Dominant Platforms: In 2025, Facebook led with 3.07 billion users, followed by WhatsApp (3 billion) and YouTube (2.54 billion).
- TikTok’s Rise: TikTok saw a dramatic increase to 1.94 billion visits, establishing itself as the fifth-largest platform globally.
- Top Visiting Countries: The US, India, and Brazil led in social media visits in 2025.
- User Demographics and Devices: Male users dominated at 54.6%, with the average user accessing 6.83 different social media platforms monthly.
10 Most Visited Social Media Websites of 2025 (Infographic)
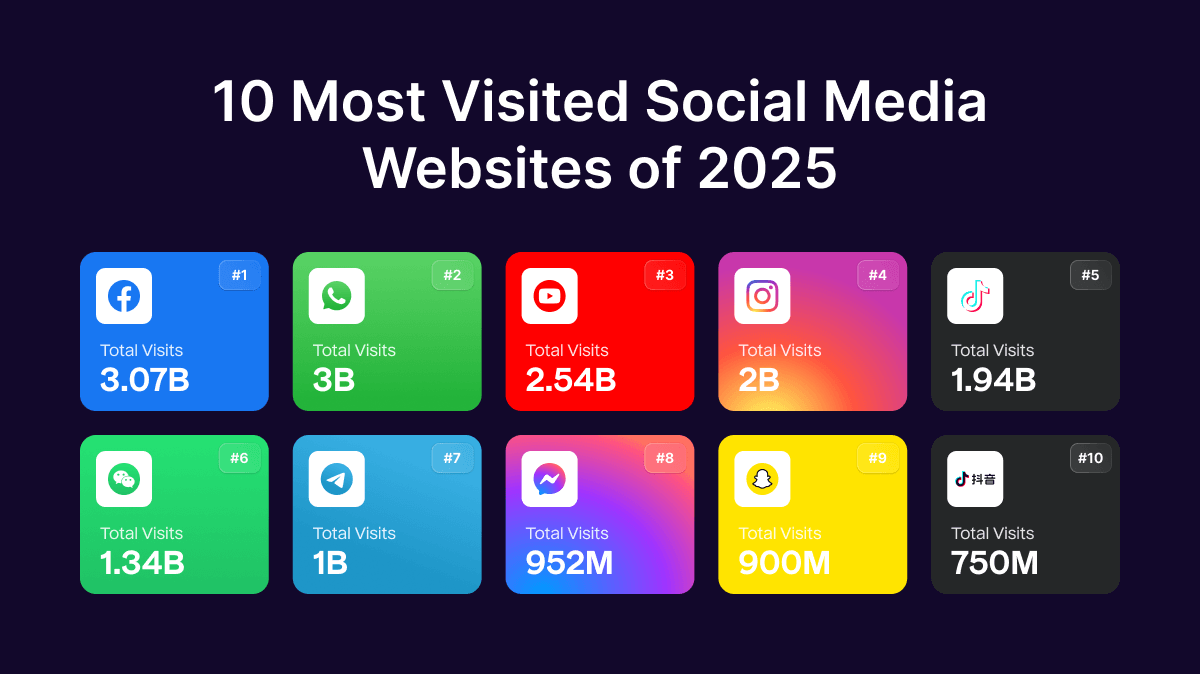
10 Most Visited Social Media Websites of 2025
Social Media Growth in the Last 5 Years (2020-2025)
Over the past five years, from 2020 to 2025, we have seen a significant increase in total visits to the top 10 social media websites. In 2020, approximately 2.95 billion people used social media worldwide. The numbers continued their upward trajectory significantly..
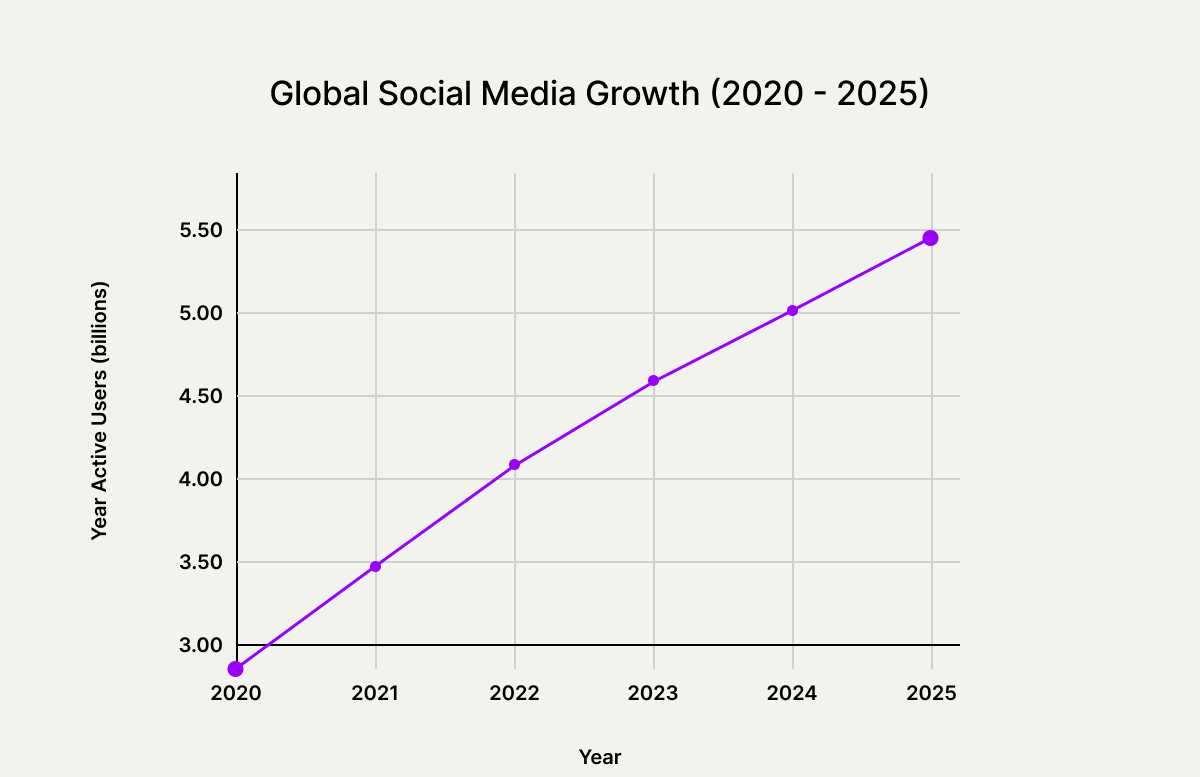
Year over year brought steady increases, with notable surges during 2021-2022, where user adoption accelerated due to pandemic-driven digital transformation. By 2025, the total reached an incredible 5.41 billion active users.
This impressive ascent in 2023 also translated into high global user activity, with average daily visits reaching 143 minutes (2 hours 23 minutes), showing people just couldn’t get enough of these addictive platforms. These figures clearly highlight widespread daily engagement across the globe.
The total growth over this period was a remarkable 2.46 billion new users, marking a substantial 83.4% increase from 2020 to 2025. This represents unprecedented expansion in social media adoption across all demographics and regions.
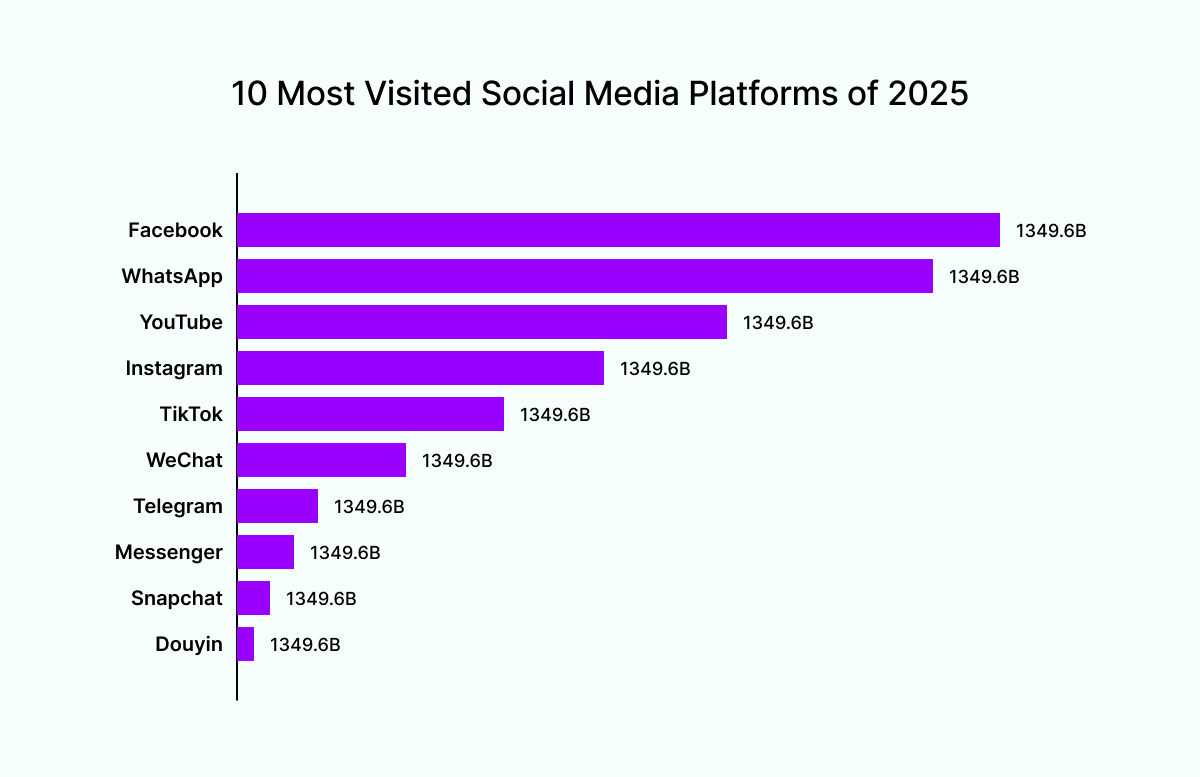
10 Most Visited Social Media Platforms of 2025
In 2025, the landscape of social media continued evolving with significant changes in user visits across the top 10 platforms. Here’s a breakdown of each platform’s performance over the last five years:
1) Facebook
Facebook maintains its position as the most popular social media platform in 2025, with 3.07 billion monthly active users and 2.1 billion daily active users. This represents continued growth despite market saturation in developed countries.
The platform remains dominant across all age groups and geographical regions, particularly strong in Asia-Pacific and Africa. Facebook’s ecosystem integration with Instagram, WhatsApp, and Messenger continues to drive user retention. As a platform for social connection, Facebook is still leading the charge on that front, making it a great idea to use an FB widget to extend that connection to your website as well.
Here are some key numbers:
- Total Visits 2025: 3.07B
- Average Daily Visits in 2025: 2.01B
- Gender Distribution: 66% Male, 34% Female
- Device Preference: 49.72% Mobile and 50.3% Desktop
2) WhatsApp
WhatsApp stands as the second-largest platform with 3 billion monthly active users in 2025. As a messaging-focused platform, it dominates communication in emerging markets and serves as a critical business tool.
The platform’s integration with business features and payment systems has expanded its utility beyond messaging, making it an essential infrastructure in many countries.
Here are some key numbers:
- Total Visits 2025: 3B
- Average Daily Visits in 2025: 1.7B
- Gender Distribution: 81% Male, 19% Female
- Device Preference: 35.8% Mobile and 64.2% Desktop
3) YouTube
YouTube maintains its position with 2.54 billion monthly active users in 2025. The platform continues to dominate video consumption and creator economy trends.
With approximately 122 million daily viewers, YouTube remains the go-to platform for video content, education, and entertainment across all demographics.
Here are some key numbers:
- Total Visits 2025: 2.54B
- Average Daily Visits in 2025: 1B
- Gender Distribution: 67% Male, 33% Female
- Device Preference: 70%+ Mobile
4) Instagram
Instagram reached 2 billion monthly active users in 2025, with approximately 500 million daily active users. The platform continues to dominate visual content sharing and influencer marketing.
Instagram’s focus on Reels and short-form video content has helped it compete effectively with TikTok while maintaining its core photo-sharing identity.
Here are some key numbers:
- Total Visits 2025: 2B
- Average Daily Visits in 2025: 500M+
- Gender Distribution: 67% Male, 33% Female
- Device Preference: 58% Mobile and 42% Desktop
5) TikTok
TikTok achieved remarkable growth, reaching 1.94 billion monthly active users with approximately 1 billion daily active users in 2025. The platform has established itself as the fifth-largest social network globally.
TikTok’s algorithm-driven content discovery and short-form video format continue to attract younger demographics and drive cultural trends.
Here are some key numbers:
- Total Visits 2025: 1.94B
- Average Daily Visits in 2025: 1B
- Gender Distribution: 69% Male, 31% Female
- Device Preference: 58% Mobile and 42% Desktop
6) WeChat
WeChat maintains its position with 1.4 billion users, primarily concentrated in China. The super-app continues to integrate messaging, payments, shopping, and social features.
As China’s dominant social platform, WeChat serves as essential digital infrastructure, combining social networking with financial and commercial services.
Here are some key numbers:
- Total Visits 2025: 1.34B
- Device Preference: 90% Mobile
7) Telegram
Telegram reached 1 billion users in 2025, emphasizing privacy-focused messaging and large group communications. The platform has grown significantly due to privacy concerns on other platforms.
Here are some key numbers:
- Total Visits 2025: 1B
8) Messenger
Facebook Messenger maintains 952 million monthly active users, serving as a key communication tool integrated with the broader Facebook ecosystem.
Here are some key numbers:
- Total Visits 2023: 952M
9) Snapchat
Snapchat reached 900 million monthly active users with 420 million daily active users, maintaining strong engagement among younger demographics.
Here are some key numbers:
- Total Visits 2023: 900M
10) Douyin
Douyin, TikTok’s Chinese version, maintains 750 million users, serving the Chinese market with integrated e-commerce features.
Here are some key numbers:
- Total Visits 2023: 750M
Top 10 Countries With the Most Social Media Visits, 2025
In 2023, the global social media landscape saw varying levels of engagement across different countries, but unsurprisingly all showed significant growth. The data presents an intriguing look at the top 10 countries with the most social media visits, offering insights into the digital behavior patterns prevalent in each nation.
1) United States
Topping the chart, the United States (unsurprisingly) accounted for a striking 21% of the total social media visits worldwide. With a population of 343 million, this amounts to an average of 1320 visits per person per year, showcasing the deeply integrated role of social media in American daily life.
2) India
Following the US, India now accounts for about 10.5% of global social media visits, with over 1.486 billion people. Though its per capita usage remains relatively lower (about 135 visits per person annually), rapid internet adoption continues to fuel a massive, expanding digital footprint.
3) Brazil
Brazil holds third place, with almost 6.5% of worldwide visits from its 220 million population. Social platforms are a daily staple for Brazilians, with a national average of about 600 visits per person per year.
4) Japan
Japan, with around 97 million social media users, contributes approximately 90 billion visits to the total, about 4.2% globally. The visit rate of 927 per user per year highlights significant social media penetration.
5) United Kingdom
The UK has a smaller user base of 55 million but exhibits strong engagement with 75 billion visits, making up 3.6% of global traffic. Users average 1,363 visits per year, indicating very active social media use.
6) Indonesia
Indonesia, hosting about 143 million social media users, generated approximately 75 billion visits, roughly 3.4% of global visits. Its users average 525 visits per year, showcasing rapid digital adoption.
7) Turkey
Turkey’s 59 million users accounted for 65 billion visits, representing 3% of total global visits. The per-user visit rate is approximately 1,102 annually, signaling strong platform engagement.
8) Germany
Germany shows 66 million users with about 60 billion visits, about 2.8% of global visits. Users average around 909 visits annually, reflecting broad platform use.
9) Thailand
Thailand’s 51 million social media users contribute approximately 55 billion visits or 2.5% of global visits. The per-user visit average is high, at around 1,078 per year.
10) Mexico
Mexico rounds out the top 10 with 93 million users and 53 billion visits, making up 2.4% of global activity. On average, users generate 568 visits annually, showing ongoing growth.
The data reveals a diverse range of social media interaction across these countries, with the United States leading by a substantial margin in both total visits and visits per capita. Social media junkies, we’ll call them.
Notably, countries with smaller populations like the UK and Germany show a high number of visits per person, indicating a possible higher penetration and reliance on social media in these populations.
Conversely, India’s massive population contributes to a lower per capita visit count, yet its sheer volume signifies an expanding digital space. These figures illustrate not only the global reach of social media but also the varying degrees of its impact on different societies.
Social Media Usage by Gender, Device, and Usage Duration, 2025
Gender Distribution:
On average, social media platforms see a male user majority at 68% compared to 32% female users. WhatsApp diverges from this pattern with a significantly higher male user base at 81%. While Twitter features a more balanced distribution of 57% male and 43% female users.
Social Media Visits by Gender 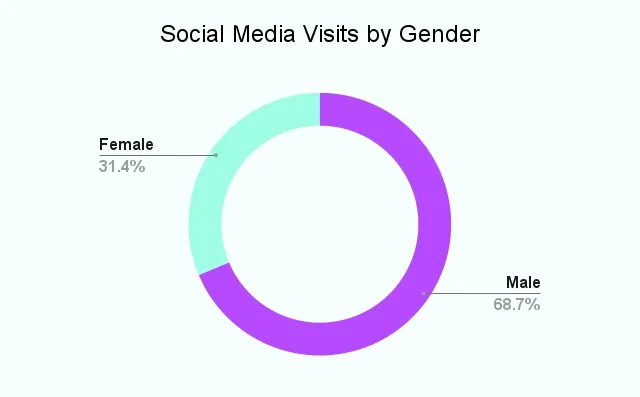
Device Preference:
Mobile remains the dominant access method with 98% of social media visits coming from smartphones or tablets. TikTok usage leads mobile access with 78%, followed by YouTube, Facebook, and Reddit, with over 70% mobile traffic.
Social Media Visits by Device 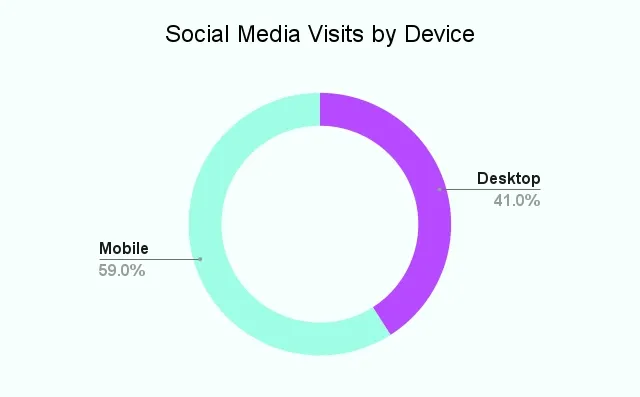
This mobile preference underscores the global shift towards smartphones as the go-to device for social media, emphasizing the importance of mobile-friendly content and interfaces. Safe to say, if it’s not accessible on mobile, or optimized through effective social media management, it won’t garner much interest.
Visit Duration (mm:ss):
Average daily time spent on social media is approximately 143 minutes (2 hours and 23 minutes) in 2025. YouTube attracts the longest sessions (~30 minutes per visit), while platforms like TikTok and Quora have shorter visits, averaging about 9-10 minutes.
Methodology
This study compiles insights from SEMrush analytics, global population reports, and social media industry data sources. It examined platform visits, user engagement trends, demographics, and device usage from 2020 through 2025, presenting a comprehensive view for marketers, analysts, and policymakers to understand social media’s evolving role worldwide.
You may also like


Essential resources for your success