Analyze

Align Marketing & Finance on a Single Causal Truth

Board‑ready insights every week – anchored in causal-based measurement – so plans get approved in minutes, not months

See Lifesight in action. Take an interactive tour

Align Marketing & Finance on a Single Causal Truth

Conflicting Dashboards Are Killing Your Growth

When marketing & finance teams operate with different sets of truth, misalignment causes the inability to speak the same language of business, profit.

68% of CMOs say conflicting dashboards delay budget sign-off.

When every team has its own “truth,” decisions stall and growth slows.

3 out of 4 finance leaders distrust marketing’s reported ROAS.

Inflated, duplicative touch-based metrics erode confidence and freeze budget approvals.

Teams don’t align and work collectively towards the same business KPI

Instead of driving business outcomes, teams are stuck in disagreement and defending themselves

A Single Source of Truth That Everyone Can Trust

Replace data disputes with collective decision making and KPI ownership, enabling teams to work together towards collective business goals.

Single Source of Truth For Every Stakeholder, Zero Debates

A single reconciled view of marketing performance based on causal measurement so everything adds up.

Single Source of Truth For Every Stakeholder, Zero Debates
Align Teams on Knowing What Moved the Needle

Align Teams on Knowing What Moved the Needle

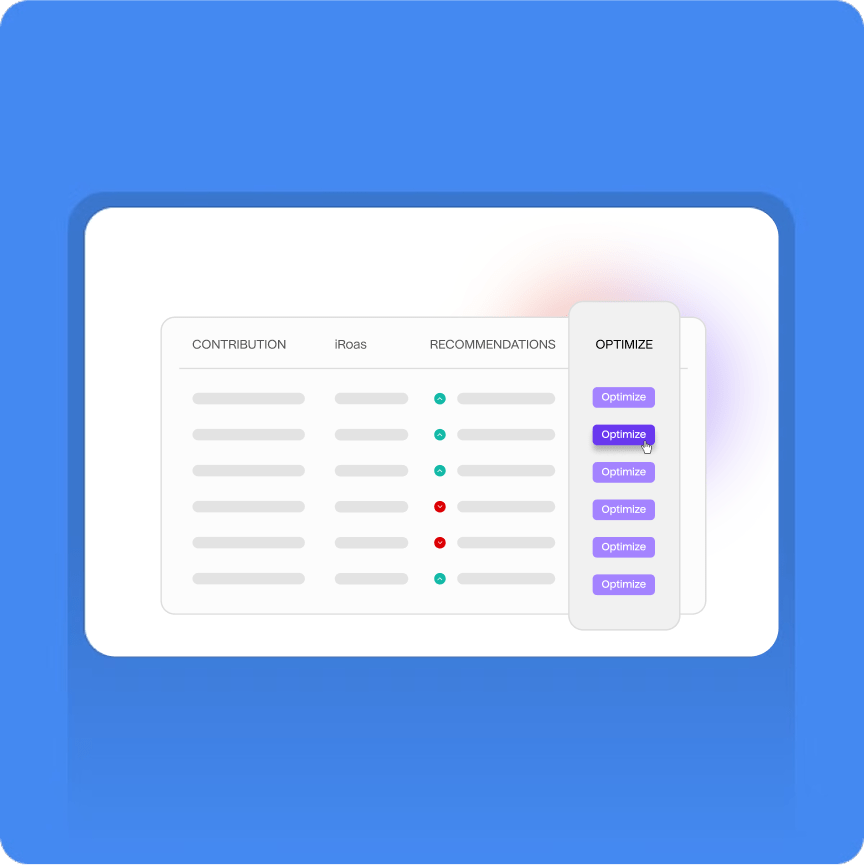
See clear contribution by channel, campaign, geo, and creative, so you know exactly what drove performance, and by how much, to make better investment decisions.

Get Instantly Actionable Board-Ready Decisions

Board-ready views and causal drill-downs cut endless debates, so approvals takes minutes, instead of weeks.

Get Instantly Actionable Board-Ready Decisions
Audit-ready Metrics, Grounded in Incrementality

Audit-ready Metrics, Grounded in Incrementality

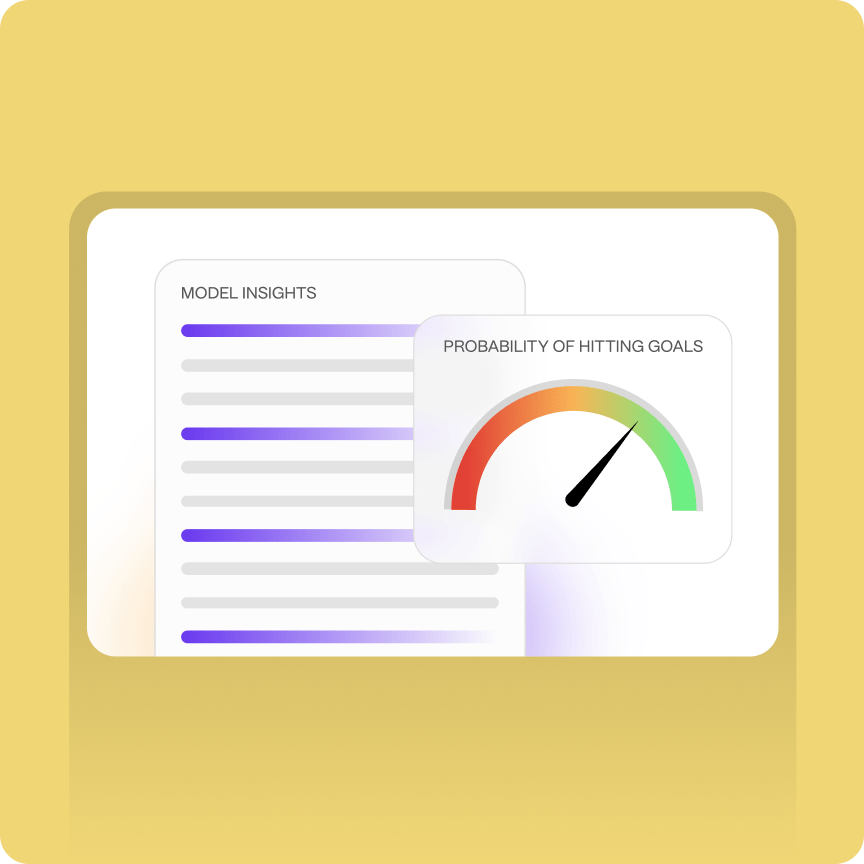
Double-click into model notes, assumptions, and data lineage. So every KPI is audit-ready, and no metric goes unexplained.

Views for Every Stakeholder

Analyze turns scattered metrics into a single truth, explaining what changed, showing plan vs. actuals. Tying every input and impact back to KPIs and delivering measurable reports to every stakeholder.

For Executive

See the big picture at a glance. Get a incrementality-adjusted P&L and top growth drivers in one board.

For Finance

ROI that matches real revenue. Every KPI is reconciled to MER, CAC, and contribution margin.

For Marketing

Clarity on what’s really working. See true incremental contribution by channel, campaign, and ads.

For Analytics

Transparency without the manual digging. Model notes, assumptions, and lineage, all built in.

Don’t Just Take Our Word for It

Hear from marketers who are growing profitably with Lifesight.

qoute icon 1 - Lifesight

“For the first time, Finance and Marketing are reading the same numbers. Every dollar spent now traces back to the real revenue that our company is generating”

– Head of Finance Operations, US based Pizza Chain

qoute icon 1 - Lifesight

“I feel more confident approving marketing budgets, because now I know it’s going to be spent on the right growth drivers with a scalable plan.”

– CEO, Fashionwear Brand

Frequently asked questions

Use templates (CMO, Finance, Performance, Agency) and publish in minutes; customize tiles, filters, and KPIs, then save as your team’s default.

Yes-create one “source” dashboard and publish role views that inherit logic but expose different tiles, targets, drill paths, and permissions.

The Metrics Library centralizes KPI formulas, lookbacks, currency, and attribution rules. Dashboards always reference the approved version.

Each dashboard supports Decision Notes, Scenario Snapshots, and a Decision Log (who changed what, when, and why) for QBRs and board packs.

It shows side-by-side role dashboards with a shared time window, so Marketing, Finance, and Sales review the same truth in one view.

Freshness shows on every tile; drill from exec KPIs to channel → campaign → creative (including lift tiles); share via links, scheduled PDF/CSV, or Slack.

Experiment results appear as lift annotations and update targets; Plan vs Live tiles compare MMM-informed plans to current pacing and push chosen scenarios to Optimization.