The second quarter of the year is off to a great start, and it’s only going to get better with the suite of updates designed to enhance our platform, making it more intuitive, insightful, and impactful.
This round of release introduces advanced visualization for immediate impact assessment, refined budgeting controls, and more precision in your Causal Inference model. Let’s get into the details:
Spend wisely with Smart Budget Modes
Take command of your marketing budget with “Smart Budget Modes”. This feature simplifies budget allocation, allowing you to automatically set up budget constraints with three strategic modes: Conservative, Moderate, and Aggressive.
This will help you automate budget utilization thresholds based on the nature of your campaign across platforms, instead of you having to set them up manually. Our Smart Budget Modes take your historic spend, seasonality, and ROAS trends into account to set the constraints — so that you get the best possible ROI from your budget.
Moderate Aggressive Manual.gif 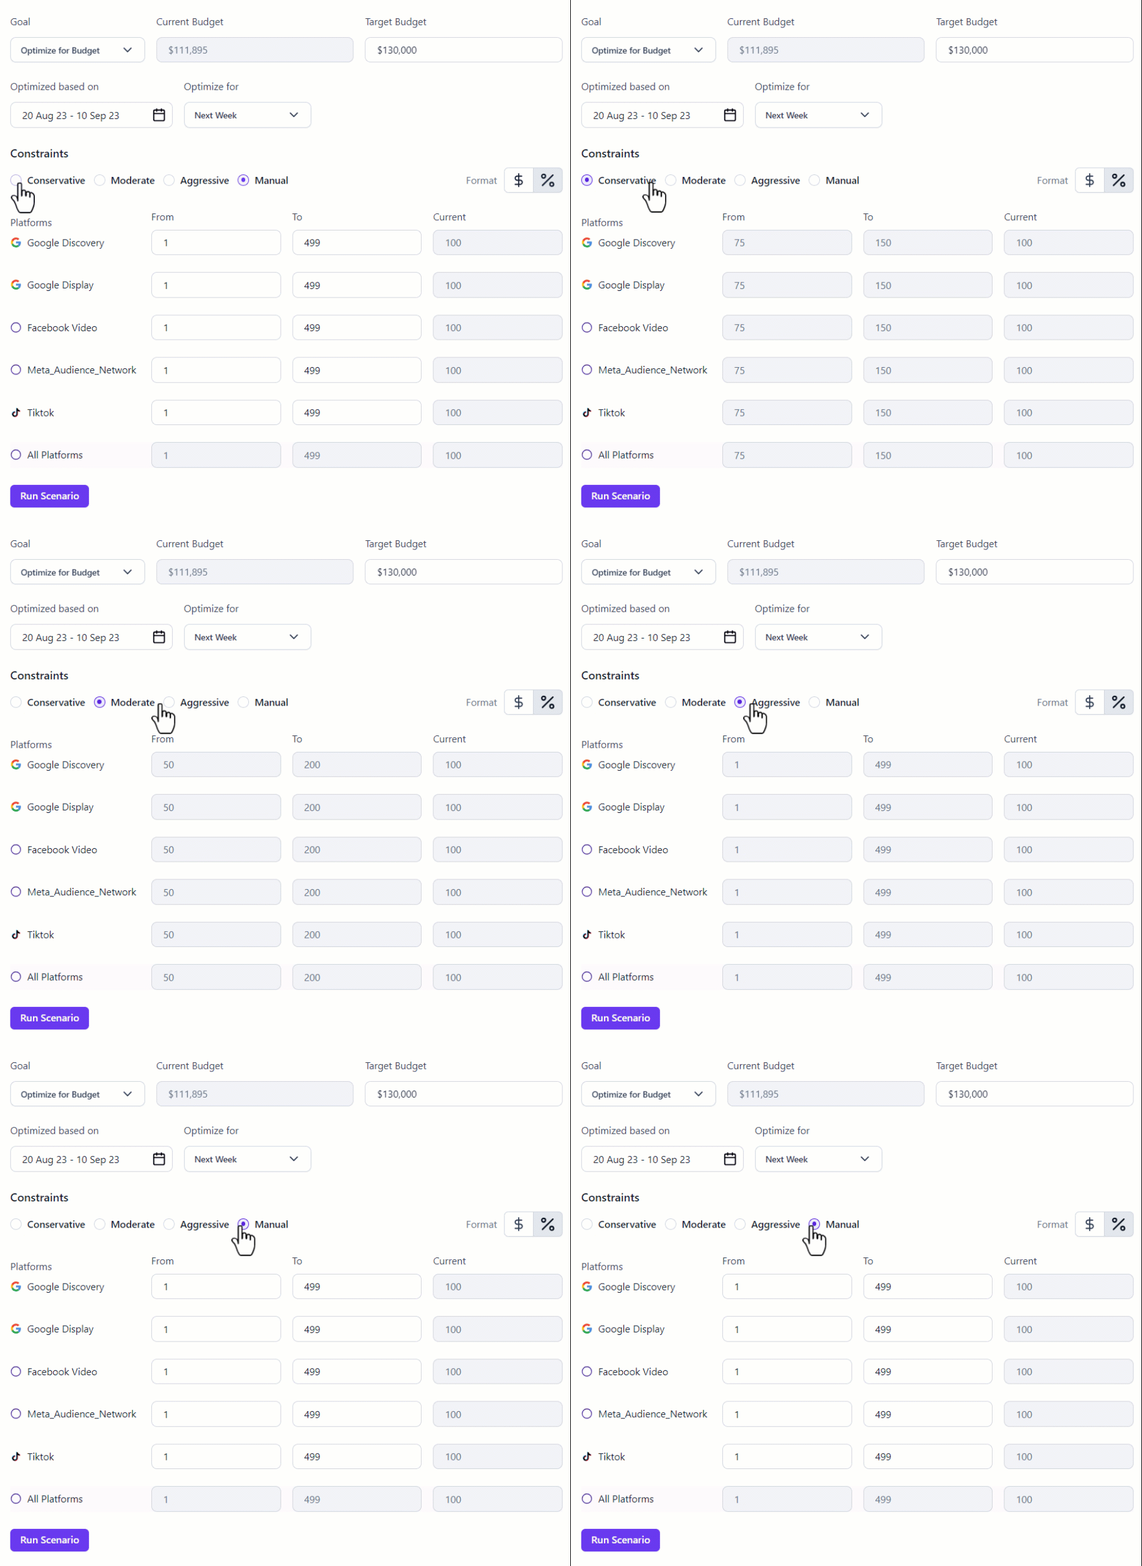
Causal Inference gets an upgrade
The newest enhancements to our Causal Inference model include data normalization and automated relationships.
Data normalization cuts down the noise from outliers and anomalies in the input data, making the model’s findings robust and more accurate.
Whereas, automated relationships take the manual work out of defining the default and forbidden relationships in your Causal Inference models every time, making the entire process of building models in Lifesight faster and easier.
Relationship.gif 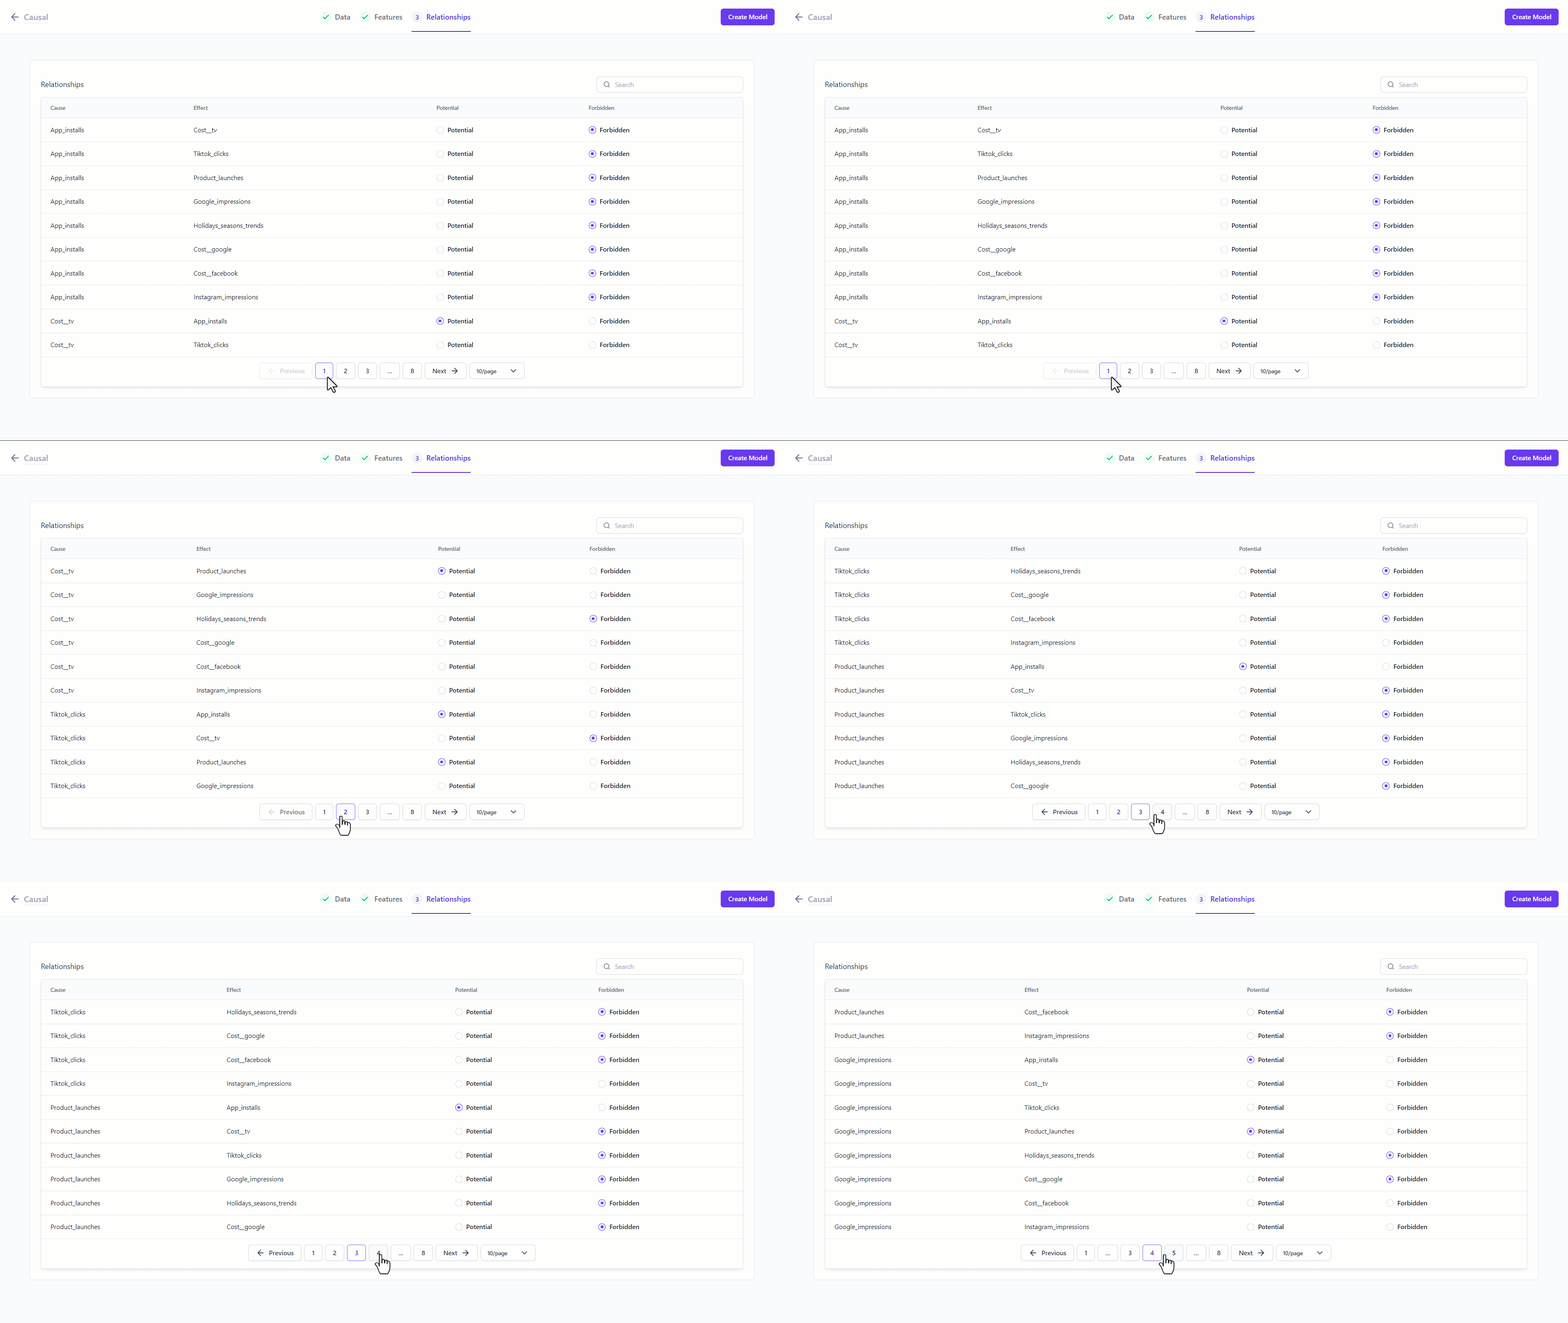
Visual refresh in MMM configuration
We’ve revamped the UI for our MMM configuration, making the impact of adstock and saturation settings more transparent. Now, you get real-time visual comparisons of your inputs and their effects: the Adstock curve illustrating the diminishing impact of ad exposure over time, and the Saturation curve depicting the diminishing marginal returns as ad exposure increase.
Ad stock Live Plots.gif 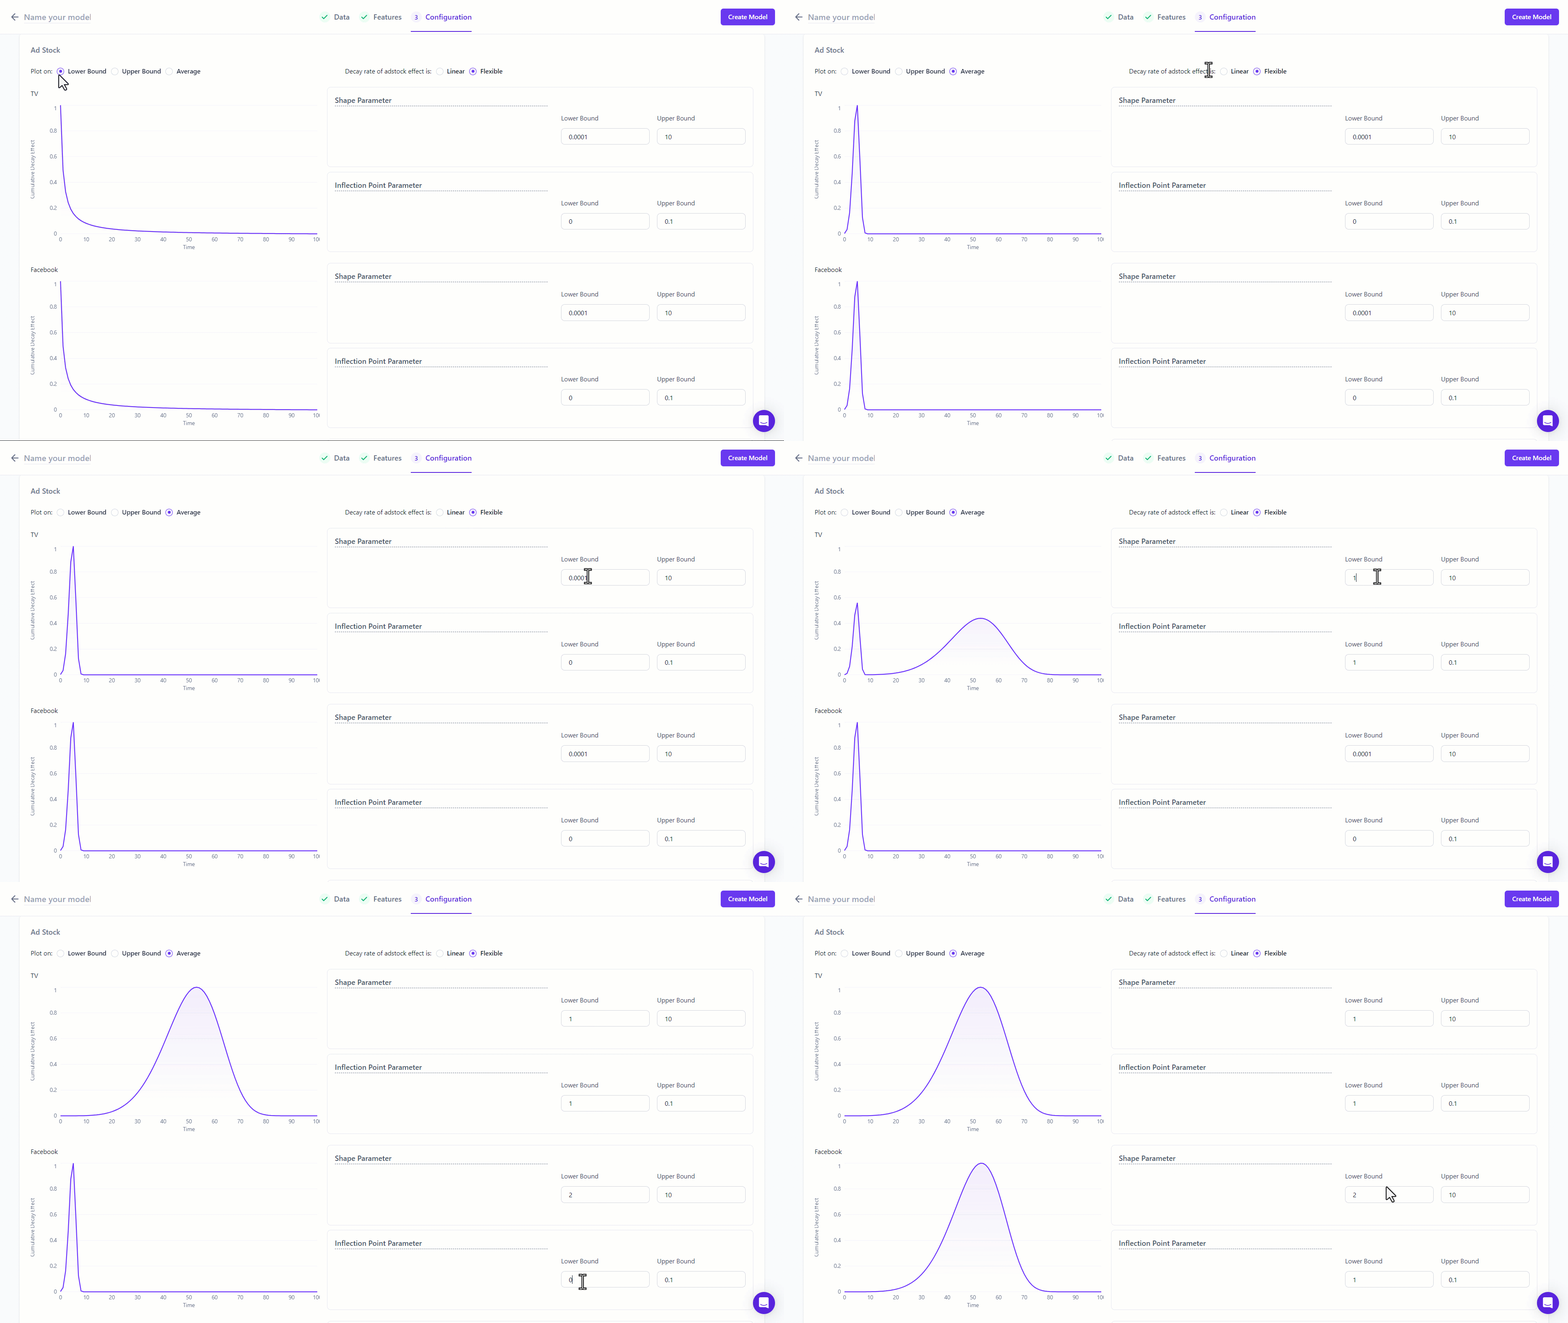
Explore this feature in detail
️Feature enhancements and lots of them!
See who’s checking out
Our Checkout tracking feature for Shopify stores captures every key event, from initiating checkout to completing a purchase. This granular view into the checkout process opens up spots for optimization, helping you refine your sales funnel for better conversion rates.
Data refresh with Google Sheets
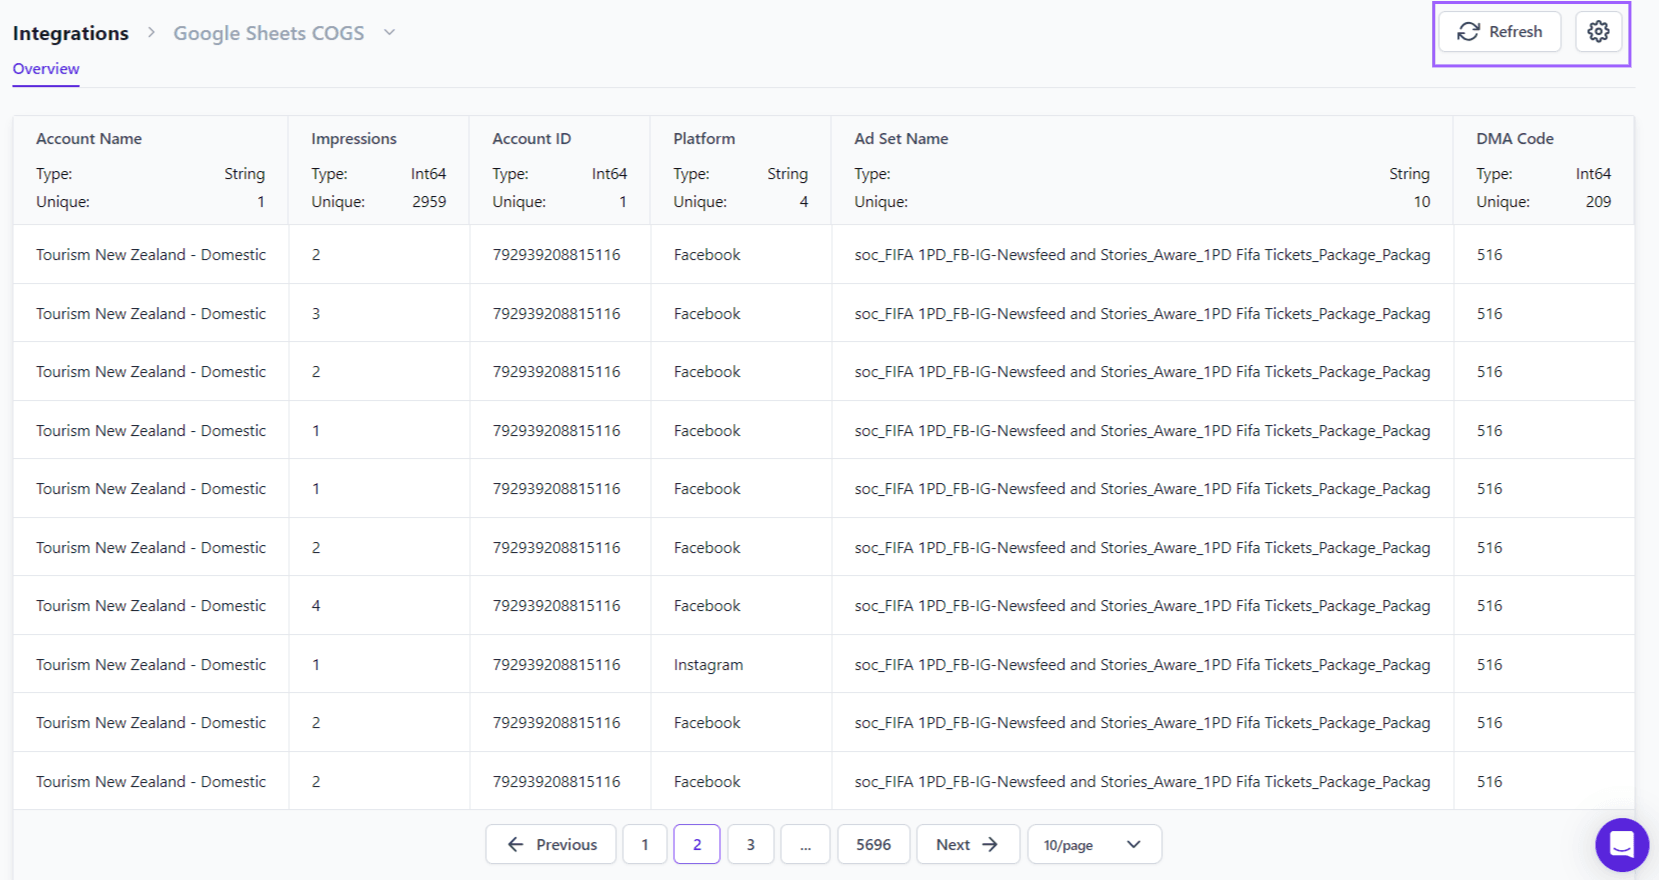
We understand the importance of up-to-date data in making swift decisions. Our new Google Sheets Refresh feature allows you to set the frequency of data updates, ensuring your analytics are always based on the latest information. Whether you’re adjusting strategies daily, weekly, or monthly, your data will keep pace.
ScreenShot Tool -20240409174248.png
Groups added to Rules & Labels ♻️
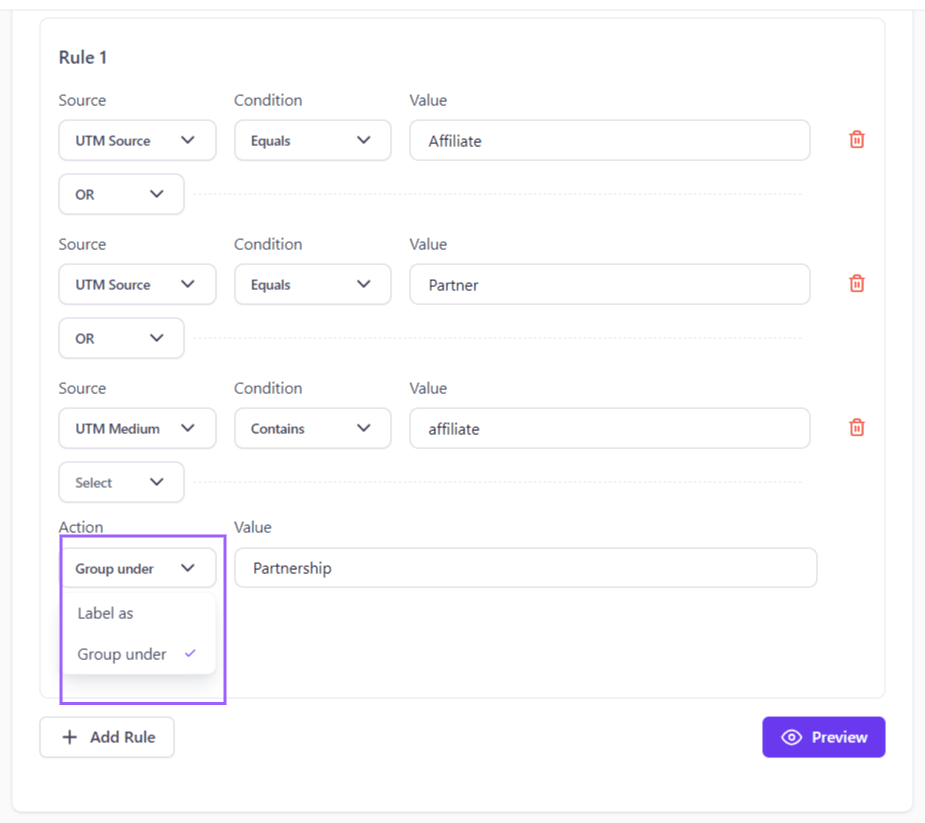
This trio makes sense of the chaos by categorizing and tagging UTM parameters with ease. Now with the newly added grouping feature, consolidate multiple entries under a unified category without altering their names. Custom rules now come with the added ability to group similar entries under a unified category. This means less time sifting through data and more time leveraging clear, actionable insights.
ScreenShot Tool -20240409175838.png
Lifesights unified measurement approach keeps getting better
These updates are for keeping our approach to measurement sharp and forward-looking. With each release, we’re not just aiming to meet current needs but to anticipate future trends. Stay tuned for more powerful additions to Lifesight—we are working on bigger ones this time.
