From powerful upgrades in our MMM and MTA modules to new integrations, learn how our latest product updates level up your marketing measurement game. Let’s jump in!
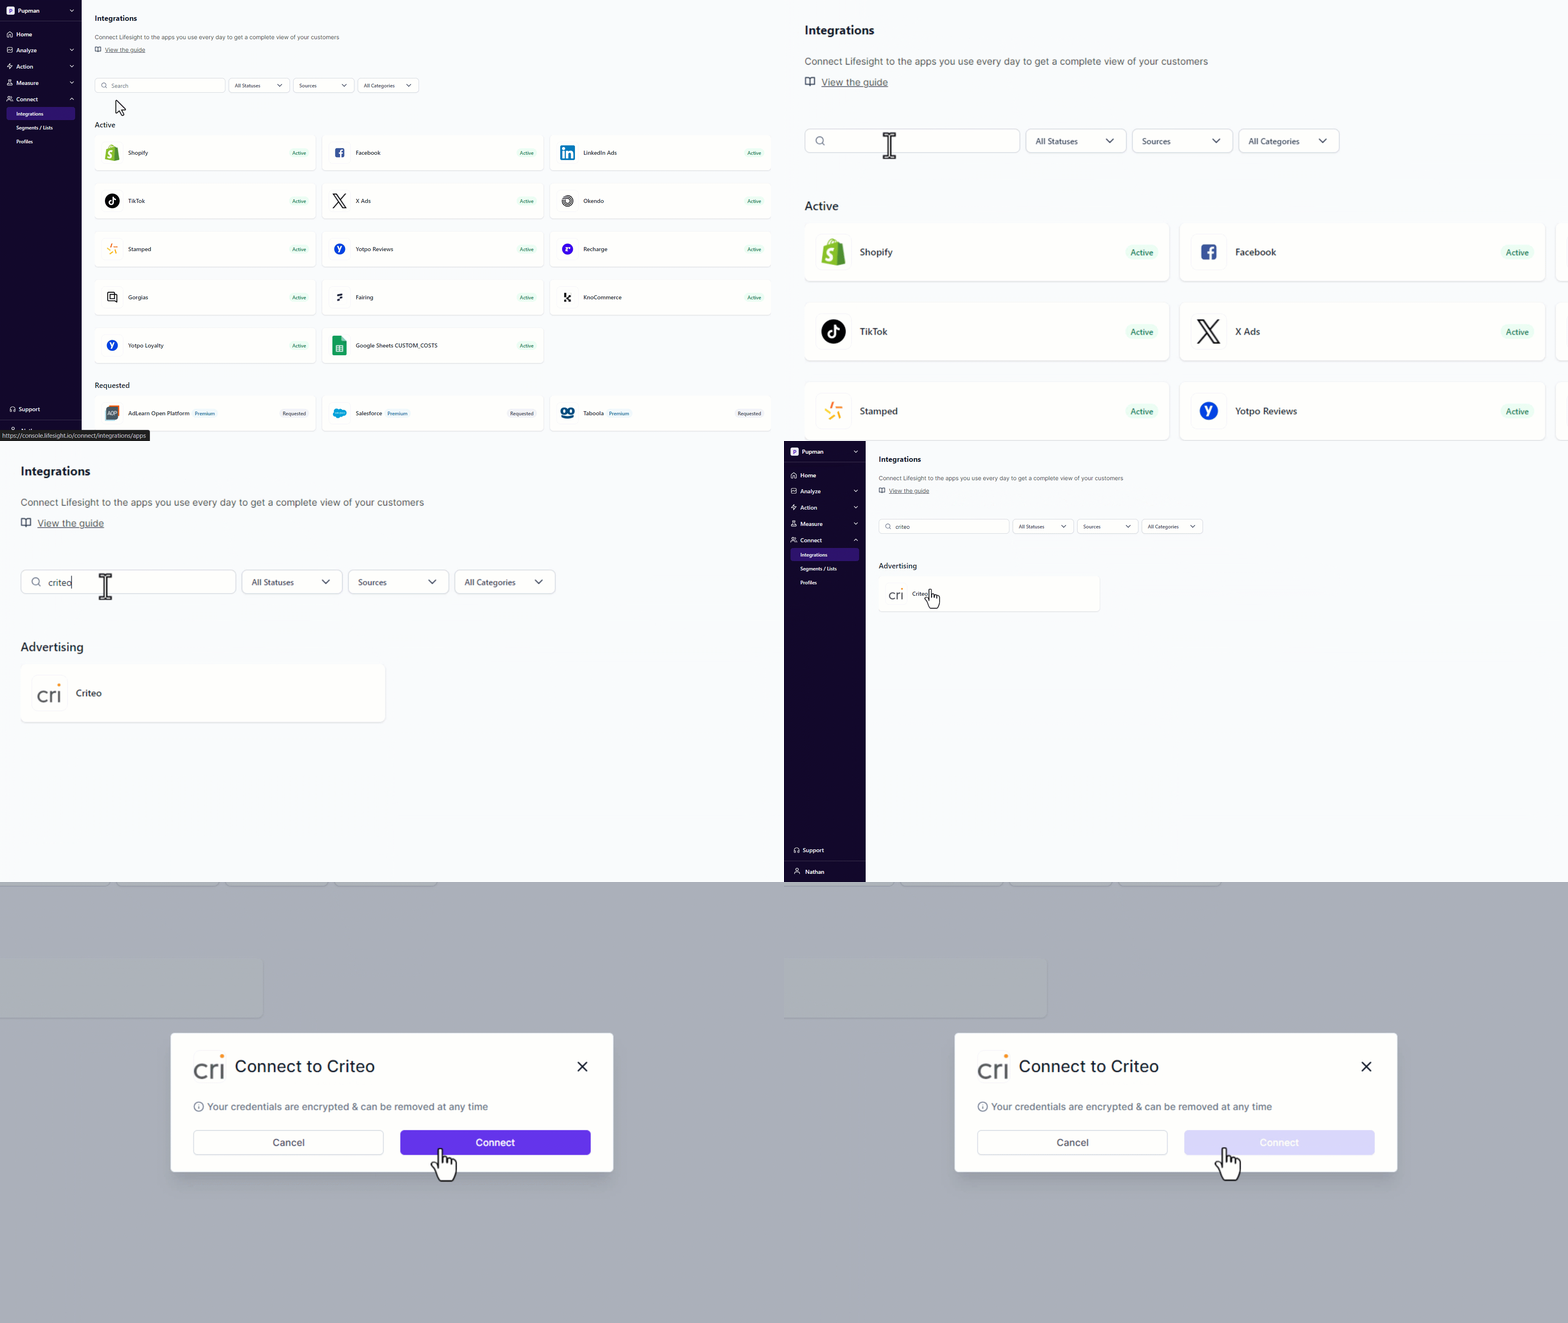
Easily bring your data in with our native Criteo integration
Introducing our integration with Criteo, a world-class Commerce Media Platform that empowers brands to drive sales and maximize ROI through targeted ads. If you’re already advertising with Criteo or considering it, this integration is for you:
Criteo Ads.gif 
- Data Integration: Easily transfer key data like historical spend, clicks, and impressions to our attribution and MMM modules for precise campaign tracking and analysis.
- Campaign Performance Insights: Access Facebook Ads performance data directly on the Attribution dashboard for actionable insights that help gauge campaign success.
- Measure incremental impact: Using our MMM, measure the incremental lift Criteo brings as a marketing channel and optimize your marketing strategy to drive better ROI.
Analyze non-purchase actions in Conversion Analysis
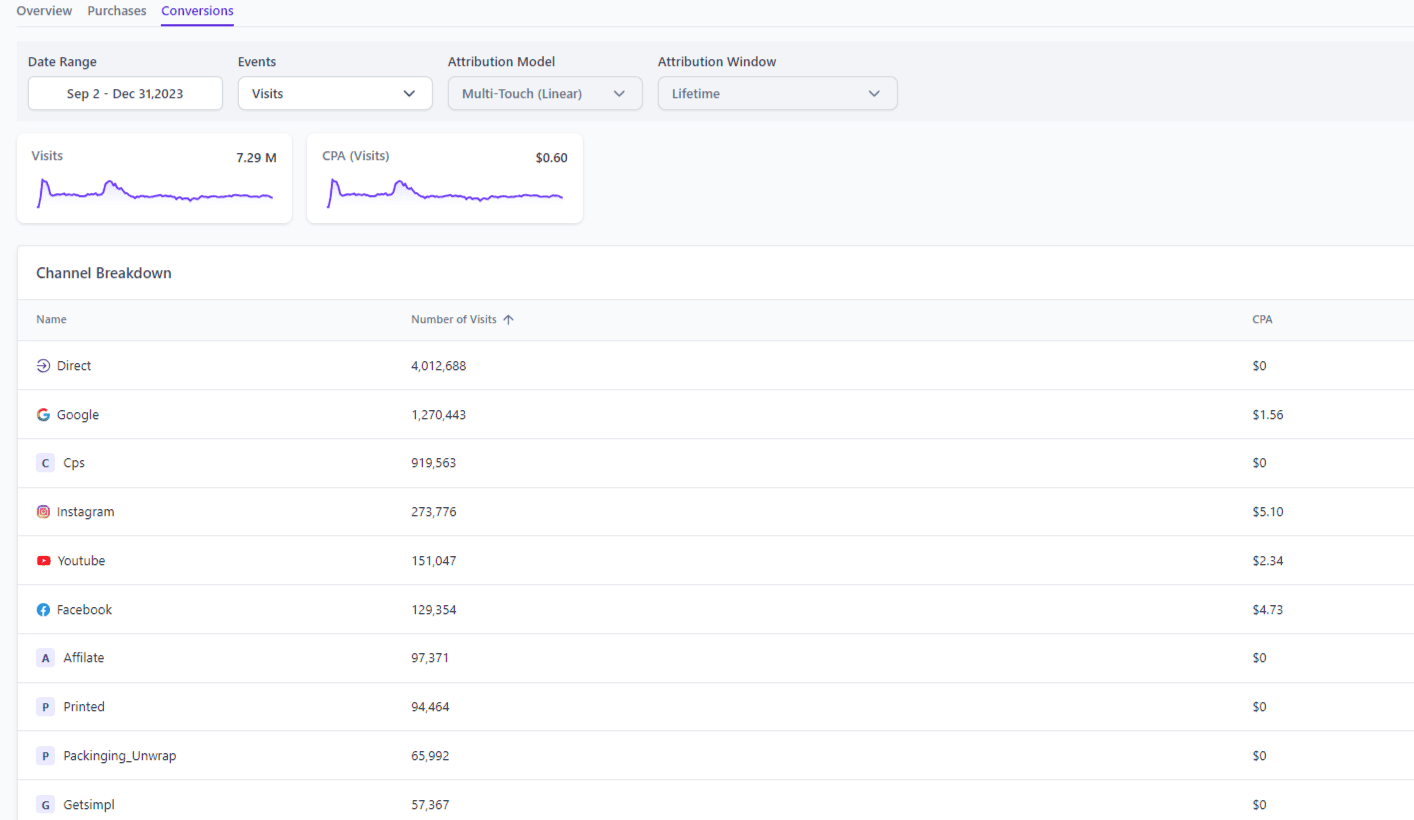
Explore user interactions more deeply with our enhanced Conversions tab on the Attribution Dashboard. Previously limited to only revenue metrics, this feature now goes beyond tracking purchases to provide a comprehensive view of user behavior.
ScreenShot Tool -20240509205914.png 
Get a detailed breakdown of conversions with enhancements in the MTA module:
- Track non-purchase events: View detailed analytics on conversion events, such as page visits, add-to-cart actions, form submissions, sign-ups, and initiated checkouts.
- Event-specific breakdowns: Obtain granular insights, including the most frequently visited pages, and top products added to the cart.
- Channel Insights: Gain insights into which channels are driving the visits and conversions.
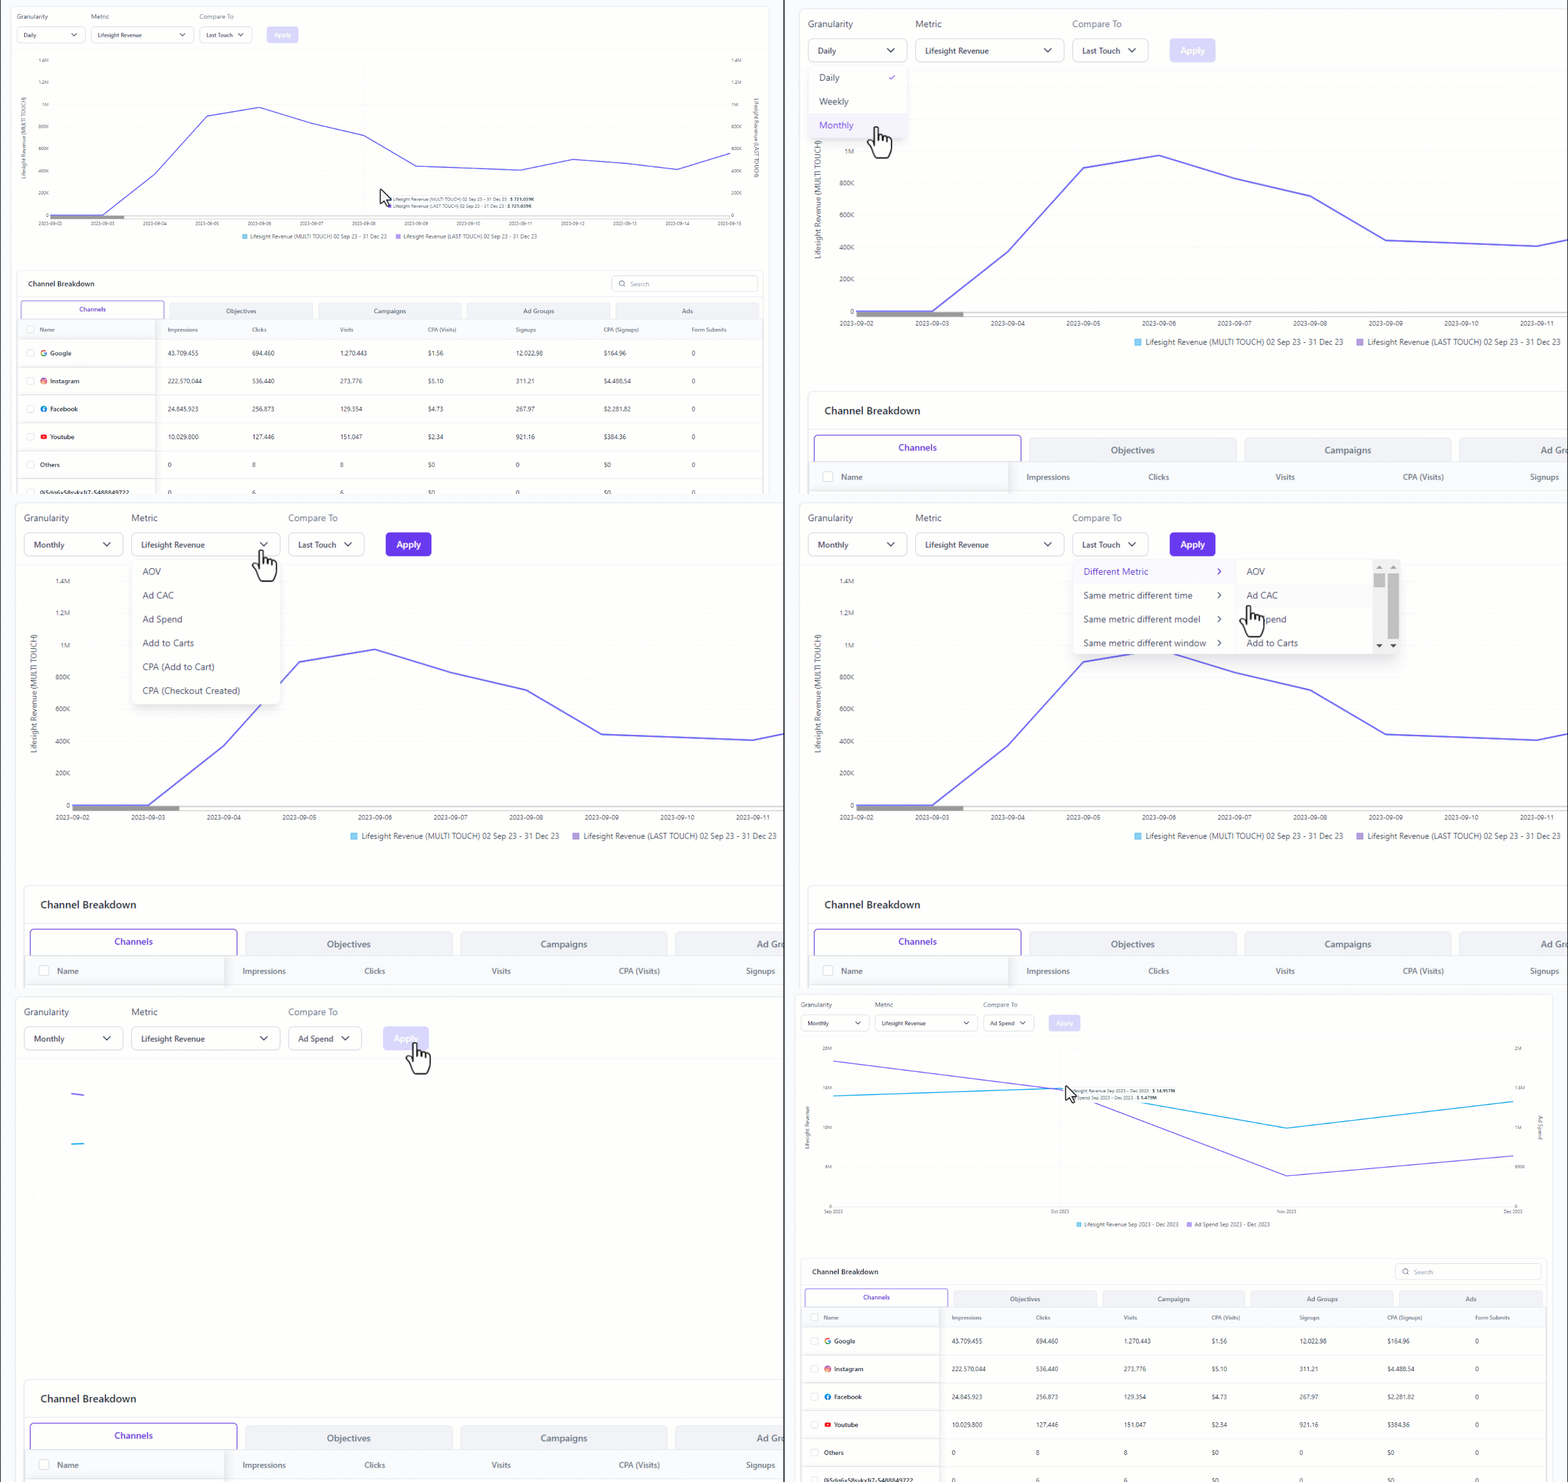
See how the metrics progress with Trend Lines
Discover deeper insights into marketing metrics with our new trend line charts on the Attribution dashboard. This helps you visualize how specific metrics evolve over time, by identifying trends, seasonal behaviors, and correlations between different metrics.
Charting.gif 
Understand your MMM better with Model Insights
Introducing the new Model tab in MMM that helps you gain better insight into your modeled data and also allows gives you the power to compare models side-by-side. Here’s a detailed breakdown of what Model Insights has to offer:
ScreenShot Tool -20240509210622.png
Master accuracy with NRMSE and Estimation error (%)
These metrics use past data to check how accurate our model are, ensuring they fit well and give reliable results. This transparency lets you see clearly what’s influencing the model.
- Normalized Root Mean Square Error (NRMSE): This metric helps you gauge the accuracy of our models by showing the average difference between predicted outcomes and actual results.
- Estimation Error (%): This metric shows the percentage difference between predicted values and actual outcomes, helping you gauge the accuracy of your predictions. It allows you to evaluate the model’s effectiveness over various time periods, ensuring it accurately captures seasonal and trend patterns in the data.
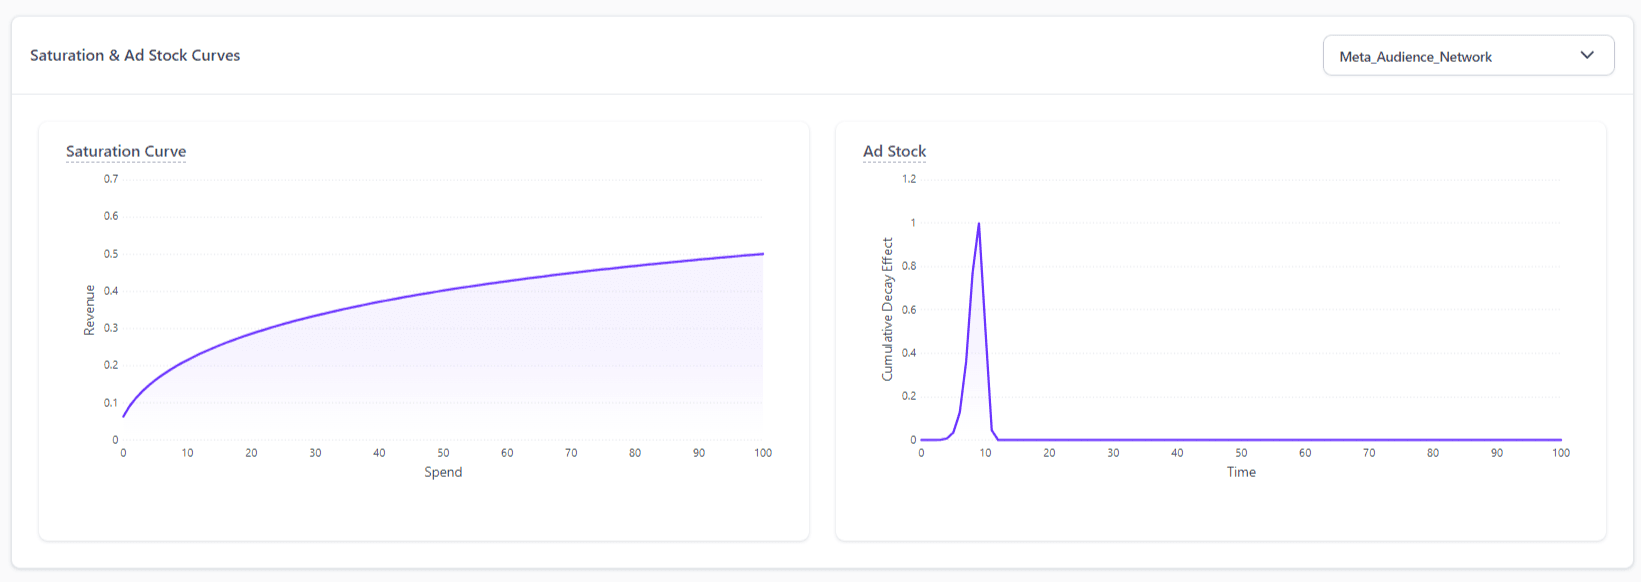
Decode short-term returns and long-term impact
ScreenShot Tool -20240509210846.png
- Ad Stock Curve: This graph highlights the lasting impact of your marketing campaigns, particularly from offline campaigns that influence consumer behavior over an extended period. It shows how past advertisements continue to influence current sales, including the lag and decay effects of ad spending.
- Saturation Curve: This graph displays the shape and slope of the saturation curve, allowing you to see the benefits of spending more on marketing decrease over time. By examining current spend levels, you can determine the marginal utility for the platform. This information is also integrated into the budget optimizer and planner to help you make smart spending decisions.
Cover the immediate impact and deferred benefits of ads
ScreenShot Tool -20240509211304.png
- Immediate Contribution: This chart helps you measure the direct impact of your advertising spend within the same period it occurs.
- Carryover Contribution: Understand the ongoing benefits of your advertising, as this tool tracks the residual effects that help boost revenue beyond the initial ad exposure period. This is essential for strategies that rely on sustained brand awareness or recurring campaigns.
Visualize ad impact and KPI alignment with MMM Insight tab
This section has been revamped for you to track and align your total spend with core KPIs, analyze how different channels contribute to your success, and visually match your efforts against industry trends.
ScreenShot Tool -20240509211452 (2).png
- Total Spend & KPIs: Track your total marketing spend alongside baseline and incremental KPIs.
- Contribution Analysis: Understand the contribution of different marketing channels on specific business outcomes with the new ‘Share of Spend vs. KPI with Incremental ROAS’ feature.
- Incremental Revenue Trends: Visualize how your marketing efforts compare against the category trends, providing a clear picture of what’s driving your KPIs.
Tap into the complete power of our latest MMM features here
Other Enhancements
- UI enhancements: We’ve streamlined the UI, particularly the correlation matrix, improving navigation with clearer spacing and better scrollability.
- Paid-only toggle: Focus exclusively on paid channels with our new toggle, ideal for brands that rely on paid media for accurate attribution. This simplifies your analysis by excluding non-paid interactions.
The enhancements we’ve introduced this month—from deeper analytical capabilities in MMM to advanced visualizations in attribution and our Criteo integration—are crafted to empower your decision-making processes with even greater precision and insight. Keep an eye on this space for more!


