The biggest challenge for a marketer managing multiple ad campaigns across channels is getting a holistic view of campaign performance. Ad performance data received at the right time can help drive timely action and course correction in campaign strategy and ensure optimum return on investment (ROI) for every dollar spent.
This blog discusses the intricacies of optimizing marketing ad spend, and provides actionable strategies to maximize ROI.
Why Optimize Ad Spend?
Marketers strive hard to capture eyeballs as more and more businesses decide to increase their digital ad spend budgets. As attention spans dwindle, attracting and retaining consumer interest is a constant challenge, often aggravated by limited budgets and demanding business needs.
In such a scenario, optimizing ad spends can help identify high-value channels and maximize ROI for the company. The process involves analyzing data and changing and improving different aspects of the ads such as creative and copy, targeting the right audience, and/or trying out different ads, bidding, and keyword strategies.
Top 4 Ad Spend Optimization Strategies
Depending on the type of insights that need to be derived, three ad spend optimization strategies can be utilized: A/B testing, lift testing, and marketing mix modeling. Here’s an in-depth look at each of these:
1) A/B testing
A/B testing is the most straightforward and preferred approach to ad spend optimization. Companies widely use it for optimizing websites (over 80%), landing pages (over 60%), and for Pay Per Click (PPC) ads (59%).
A/B testing involves testing different variables and determining which ones drive the maximum impact.
The “A” and “B” in A/B Testing refer to the two versions being tested: The control (A) and the variant (B).
For example, a digital marketing agency running a Facebook ad campaign for a client promoting a new product will create two versions of the ad:
- Version A: Known as the Control ad, it could present the product image with a simple headline and call-to-action (CTA)
- Version B: Known as the Variant, this could have a different product image, a more compelling headline, with an added “limited-time offer” incentive in the CTA
The agency will run both ad versions simultaneously and target them at different audience sets. If data shows that version B is having better click-through rates (CTR) and conversions, then the agency can implement necessary changes to the ads and optimize ad spends accordingly.
Implementing A/B testing in a structured manner involves the following:
1) Selecting platforms
There are several A/B testing platforms, such as Google Optimize, Optimizely, and Omniconvert, that help run tests and provide relevant data. Deciding on the right platform should be based on its ability to continuously respond to changes in marketing elements being tested, such as email subject lines, website elements, or digital ads.
2) Defining test groups
The next step is mapping and identifying test candidates for the control group (A) and variant group (B) and minimizing bias.
Consider demographics, behavior, geographic location, etc. and, based on the A/B testing tool being used, define the sample size along with the test duration. A sample size calculator can also ease the process.
3) Implementing tests
The next step is to run the respective campaign variants. Ensure the variations are correctly depicted for each treatment group and the process runs without technical glitches. Establishing protocols and procedures ensures consistency and reliability throughout the test.
For example, when running out of email campaign variations, ensure that emails are sent turn-by-turn to test groups under the same conditions and at the same time. Moreover, the testing process should be monitored closely to promptly identify and respond to the patterns that might lead to errors or disagreements.
4) Measuring and analyzing results
Measuring and analyzing is the most critical part of A/B testing and generally a statistical significance of 95% indicates a clear winner.
However, what if the test does not show much difference in results between the two variants? Then it means the variables did not significantly affect the results, rendering the test inconclusive.
The next step is to use the failed data to create a new interaction for another test.
5) Interpreting A/B testing results
While the implementation phase focuses on executing the planned tests, the interpretation phase shifts the focus toward analyzing the data collected and deriving actionable insights.
Compare the various performance metrics, such as conversion rate, and click-through rate (CTR).
Also look at:
Cost Per Acquisition (CPA) of each variant, which will help evaluate efficiency in acquiring new customers or leads. A lower CPA indicates that the variation is more cost-effective in generating conversions, maximizing ad spend’s ROI.
Evaluating Return on Ad Spend (ROAS) is also crucial. Higher ROAS indicates that the variation generates more revenue than the ad spend, resulting in higher overall profitability.
2) Lift test
Lift test is a form of A/B testing. It is used to measure the impact of a specific campaign or ad by comparing the behavior of a group that was exposed (treatment) against a similar group that was not (control).
It generally includes geo experiments and audience split tests.
Geo experiments: This type of lift test involves selecting specific geographic areas to receive a particular advertising campaign, while comparable areas do not. By comparing sales or conversion data from these different regions, marketers can infer the incremental impact of the campaign attributable to the advertising efforts.
For instance, a beverage company might launch a new ad campaign in the Midwest but not in the Northeast. If sales increase in the Midwest relative to the Northeast beyond typical regional variance, the campaign can be credited for that lift.
Audience split tests: Similar to geo experiments but focusing on demographics rather than location, the audience split tests segment the target market into different groups based on attributes like age, interests, or behaviors. One segment is exposed to the campaign, while the other serves as the control. The resulting performance data allows marketers to fine-tune their strategies to the segments that are most responsive to their campaigns.
Implementing these types of lift tests enables more precise measurement of a campaign’s effectiveness. With Lifesight’s Incrementality Testing feature, you can gain a deeper understanding of how your campaigns drive incremental conversions and revenue, ensuring you’re not just spending efficiently, but also effectively.
3) Marketing Mix Modeling (MMM)
Marketing Mix Modeling is an analytical technique used to understand the impact of various marketing activities on business outcomes. It provides a comprehensive approach to analyzing the effectiveness of marketing strategies across different channels and touchpoints. Let’s look at the process of implementing MMM in more detail:
Gathering historical data
Historical data includes data from different sources, such as sales records, advertising spending, pricing information, and market share data. This forms the foundation for analyzing past marketing activities and their impact on business objectives.
This data can show trends, patterns, and relationships between marketing inputs and performance metrics over a season. To get accurate insights from MMM, the historical data quality must be good, accurate, and complete.
Building or choosing a model
Once historical data is collected, the next step is to build or choose a suitable model for MMM based on business objectives, data characteristics, and analytical requirements.
Some commonly used models are regression analysis, time series analysis, econometric models, and machine learning (ML) algorithms. Some also build custom models or leverage pre-existing models developed by industry experts or third-party providers.
However, while creating custom models, it is essential to capture the complex relationships between marketing inputs and business outcomes and provide accurate predictions.
Lifesight’s Casual MMM employs advanced ML for precise insights into ad channel effectiveness, offering granular insights, accurate measurement, and strategic spending prioritization. Together with the budget optimizer tool, it ensures every dollar yields maximum ROI by removing the guesswork.
Calibrating with lift test data
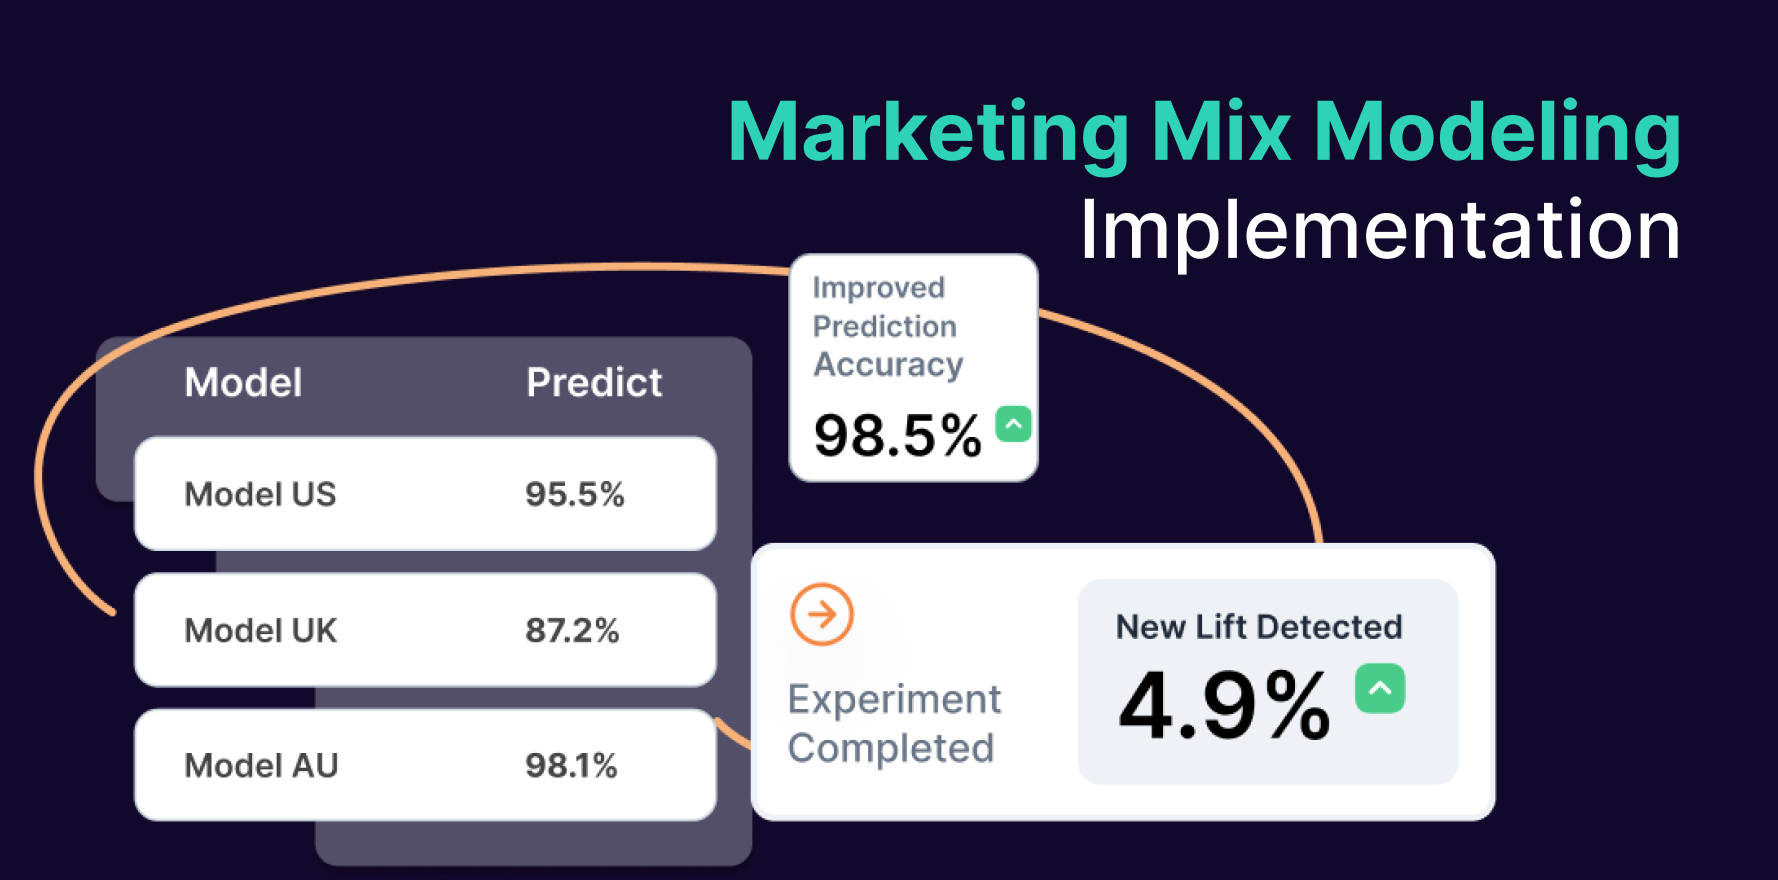
Lift test data provides a reliable benchmark for evaluating MMM’s predictive power. Aligning the model’s parameters with the lift test results ensures that the model reflects real-world dynamics and provides reliable projections for future campaigns. This adds credibility and helps build confidence in the model’s ability to guide strategic decision-making and optimize the ad budget.
Utilizing MMM for budget allocation
To use MMM for budget allocation, analyze the performance metrics derived from the MMM analysis. Identify the channels that contribute most effectively to KPIs, such as sales revenue, conversion rates, or ROI.
It is then easy to allocate your budget to platforms that demonstrate high efficacy in driving desired results. Keep the marginal returns of additional investments in check while doing so.
It is also important to continuously monitor and adjust ad spend distribution based on the market scenario, consumer behavior trends, and external factors.
4) Multi-Touch Attribution (MTA)
Multi-Touch Attribution (MTA) models play a crucial role in optimizing ad spend by providing granular insights at both the campaign and creative levels. Unlike traditional last-click attribution models, MTA takes into account all the touchpoints a customer interacts with before converting. This nuanced view allows marketers to understand which specific campaigns and creative elements contribute most significantly to conversions and sales.
For example, by implementing MTA models, you can determine if a video ad on social media or a display banner on a news site is more influential in the customer journey. You can then allocate more budget to the higher-performing creatives, optimizing your spend for maximum effectiveness.
With Lifesight, you can not only track which campaigns are driving the best results but also drill down to see how individual creatives are performing. This level of detail empowers you to invest wisely in the campaigns and creatives that truly move the needle, ensuring that your marketing dollars are spent both efficiently and effectively.
Final Thoughts
Today’s omnichannel marketing, optimizing ad spend isn’t just about cutting costs. It’s about investing smartly to weave the strongest threads of consumer connection. Whether it’s the sharp precision of A/B testing, the discerning insights from lift tests, or the overarching strategy enabled by Marketing Mix Modeling, the ultimate goal remains constant: to maximize ROI and drive sustainable growth.
Ready to see the difference a unified approach can make? Book a free demo with Lifesight today and steer your campaigns towards unmatched success.
You may also like
Essential resources for your success


