Introduction
Average Session Duration in Google Analytics measures the average length of time users spend on your website during a single session. This metric is important because it helps you gauge how engaging your content is and how effectively your website retains visitors. A higher average session duration often indicates that users find your content valuable and are spending more time exploring your site. This step-by-step guide will help you locate and understand this metric within Google Analytics, enabling you to make data-driven decisions to improve your site’s performance.
Step 1: Access Your Google Analytics Account
To begin, log in to your Google Analytics account using your credentials. Ensure you have access to the relevant website property for which you want to analyze the average session duration. If you do not have access, you may need to request it from the account administrator.
login-into-google-analytics
Step 2: Navigate to the Right Property and View
Once logged in, select the appropriate account, property, and view from the account selection menu at the top of the page. This ensures you are analyzing the correct website data. If you manage multiple properties, be careful to choose the one you are currently working on.
Step 3: Go to the Audience Overview Report
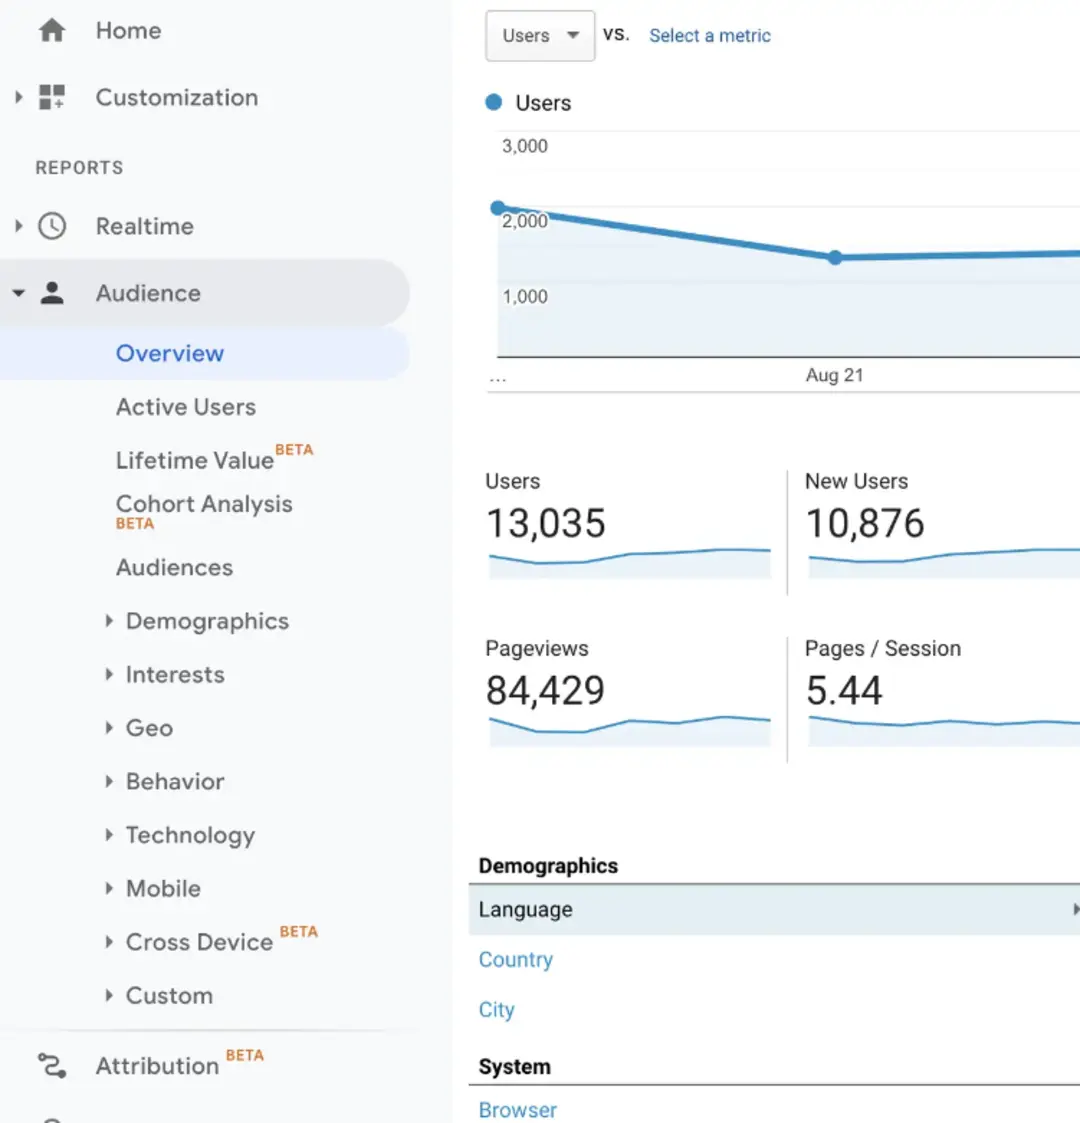
From the main dashboard, navigate to the “Audience” section located in the left-hand sidebar. Click on “Overview” under the Audience tab. The Audience Overview report provides a summary of key metrics for your website, including average session duration.
audience-overview-report
Step 4: Locate the Average Session Duration Metric
In the Audience Overview report, you will see several key metrics displayed at the top of the page, including the number of users, sessions, pageviews, and session duration. The “Avg. Session Duration” metric is displayed here, representing the average length of time users spend on your site. This metric is typically shown in the format of minutes and seconds.
Step 5: Drill Down for More Details
To gain deeper insights into average session duration, you can explore more detailed reports within Google Analytics. For instance, under the “Audience” section, you can click on “Behavior” and then “Engagement.” This report breaks down session durations into different time ranges, providing a more granular view of how long users stay on your site.
Step 6: Compare Across Different Segments
To understand how different user segments affect average session duration, use the segmentation feature in Google Analytics. Click on the “Add Segment” button at the top of the report and choose segments like new vs. returning users, traffic sources, or demographics. This allows you to see how different groups of users interact with your site, providing valuable insights for targeted improvements.
Step 7: Analyze Trends Over Time
Analyzing trends over time can provide insights into how changes on your website impact user engagement. Use the date range selector at the top right of the Google Analytics interface to compare average session duration over different periods. Look for patterns or anomalies that can inform your strategy, such as spikes during specific marketing campaigns or drops during website changes.
Step 8: Set Up Custom Insight Alerts
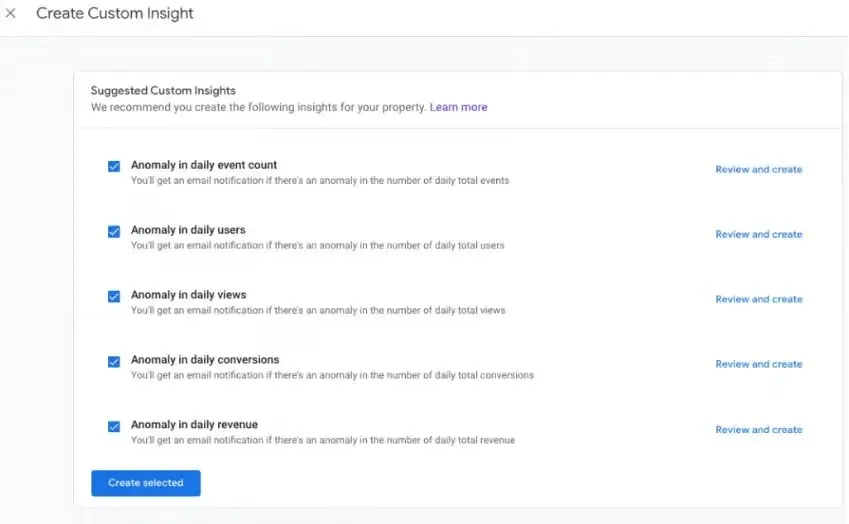
To set up custom insights alerts in GA4, go to “Reports” and then “Analysis Hub.” Create or open an exploration, adjust the metrics and dimensions to your needs, and save it. Select “Create Insight Alert,” set your trigger conditions, and choose how often you’d like to be notified. This keeps you updated on key data changes.
create custom insight alerts
Step 9: Interpret the Data
Interpreting average session duration data involves understanding its context and implications. A low average session duration might indicate that users are not finding your content engaging or that there are technical issues causing them to leave quickly. Conversely, a high average session duration suggests that users are engaged and spending more time on your site. Consider other related metrics, such as bounce rate and pages per session, to get a comprehensive view of user behavior.
Step 10: Take Action Based on Insights
Finally, use the insights gained from analyzing average session duration to make data-driven decisions. If the duration is low, consider improving your content, enhancing site navigation, or optimizing load times. For high average session duration, identify what is working well and apply similar strategies across other parts of your site. Continuously monitor and adjust your tactics based on ongoing analysis.
Summary
Finding and analyzing the average session duration in Google Analytics is crucial for understanding user engagement on your website. By signing in to your account, navigating to the Audience Overview report, and exploring the average session duration metric, you can gain valuable insights into how long users are interacting with your site. Enhancing your analysis with custom reports and goals will further refine your understanding of user behavior, helping you make informed decisions to improve content strategy and overall website performance.
Free essential resources for success
Discover more from Lifesight


