“If all you have is a hammer, then every problem will appear as a nail to you”
This mindset is all too common in the marketing measurement landscape, where vendors committed to a single methodology—whether attribution, media mix modeling (MMM), or incrementality testing—often try to force-fit their preferred approach to every measurement challenge.
Here are some scenarios:
- Attribution vendors often try to tackle every measurement problem by stitching together complex, yet incomplete, user journeys. In doing so, they attempt to turn a causal question into a credit allocation exercise – while also introducing significant privacy risks along the way.
- MMM vendors position media mix modeling as a cure-all for measurement challenges. To compensate for missing or weak variables, they often lean on arbitrary priors, questionable assumptions, and dummy variables – giving the model an illusion of robustness that doesn’t always hold up under scrutiny.
- Experiment vendors tend to dismiss all other measurement approaches as flawed, championing experiments as the only reliable way to measure impact. They frequently draw comparisons to randomized controlled trials (RCTs) in medicine—implying, sometimes unrealistically, that marketing experiments are conducted in similarly pristine, tightly controlled environments.
Marketing effectiveness is a complex, multi-dimensional problem. No single method can capture the full picture on its own. To truly understand what’s working and optimize with confidence, brands need a balanced measurement strategy that combines multiple techniques, each addressing different aspects of causality, attribution, and optimization.
So, what does this mean for marketers in practice? Where should they begin, and how should they think about building a more robust measurement strategy? The first step is to recognize the true nature of the challenge: measurement is not just about collecting data or applying the latest model—it’s about enabling better decisions.
To answer how to measure effectively, we should first ask: What decisions should good measurement empower?
1. The Hierarchy of Marketing Decisions
To understand what good measurement should support, it’s important to first examine the types of decisions marketers make.
These decisions can be mapped into a hierarchy, as shown below:
| Level | Type | Description | Timelines | Personas |
|---|---|---|---|---|
| 1 | Strategic | High-level decisions such as:
• Budget mix • Target KPIs / North Star metrics • Profitability & efficiency goals • Pricing & promotions • Special events & product launches • New partners, influencers, affiliates • Distribution strategies |
Quarters | CMO, CFO, CEO |
| 2 | Tactical | Mid-level adjustments, including:
• Budget changes at the channel/tactic level (decisions to scale, cut, maintain) • Creative strategies |
Months | CMO, Marketing Managers |
| 3 | Operational | Day-to-day execution, such as:
• Budget changes at the campaign/sub-campaign level • Bid decisions • Creative testing • Audience testing |
Days to weeks | CMO, Marketing Managers |
The purpose of a measurement system is to empower effective decision-making across all levels of this hierarchy. Some decisions are frequent and relatively low-stakes; others are infrequent but critical, with significant business impact.
When evaluating different measurement techniques, we should focus on what types of decisions each method can—and cannot—effectively support at these different levels. This alignment between measurement and decision-making is key to driving real marketing performance.
Do not seek information that cannot influence your action – (paraphrasing) Peter F Ducker
Now, let us evaluate Touch based Attribution from the perspective of this decision hierarchy
Attribution started as an attempt to (data) engineer a solution for the measurement problem – by collecting as much user-level data as possible. However, the industry eventually faced the reality that collecting all the exposure data was neither technically feasible nor permitted. This led to the adoption of data mining techniques on whatever data could be gathered. There was enough depth in the available data – it was big data enough – to apply algorithmic models on the user journeys.
Fallacy # 1 : Big Data is Better than Small Data.
Truth : Big data does not mean better insights. Data needs to be meaningful and not necessarily big. We pursue more data so as to eliminate uncertainty, but the reality is that uncertainty can never be completely eliminated. However, a better mental model is that the right data can help minimize uncertainty.
However, the reality (and futility) of touch-based attribution as a decision-making tool is slowly sinking in. How do we quantify adstock? Do we understand media saturation & diminishing returns? Can we apply basic time series forecasting on these user journeys? Is there any way to use predictive analytics on the metrics provided by attribution? And what about concepts like incrementality and marginal returns – do they even matter?
Measurement systems should provide marketers with two core features:
1) the ability to infer causality, and
2) the ability to quantify incrementality.Touch-based attribution offers neither, while also being a massive engineering undertaking. The fundamental question, then, is: what is the utility of such a system?
Today, we see a steady exodus of decision makers from conventional attribution toward the world of econometrics—specifically, to MMM and to Experiments, and other emerging modeling techniques (We refer to this as Incrementality Systems of measurement).
However, in this new world of Incrementality Systems, the nature of the data is very different. Here, data is small, irregular, and sparse, and the signals are weak. Staying within these data limitations, vendors are selling “magic algorithmic potions” that claim to infer unlimited intelligence from limited data.
The core problem of marketing measurement is unsolvable and nondeterministic in its truest sense: modeling human psychology with math on incomplete or non-existent data.
So, is there a solution? Where does the Measurement Utopia lie?
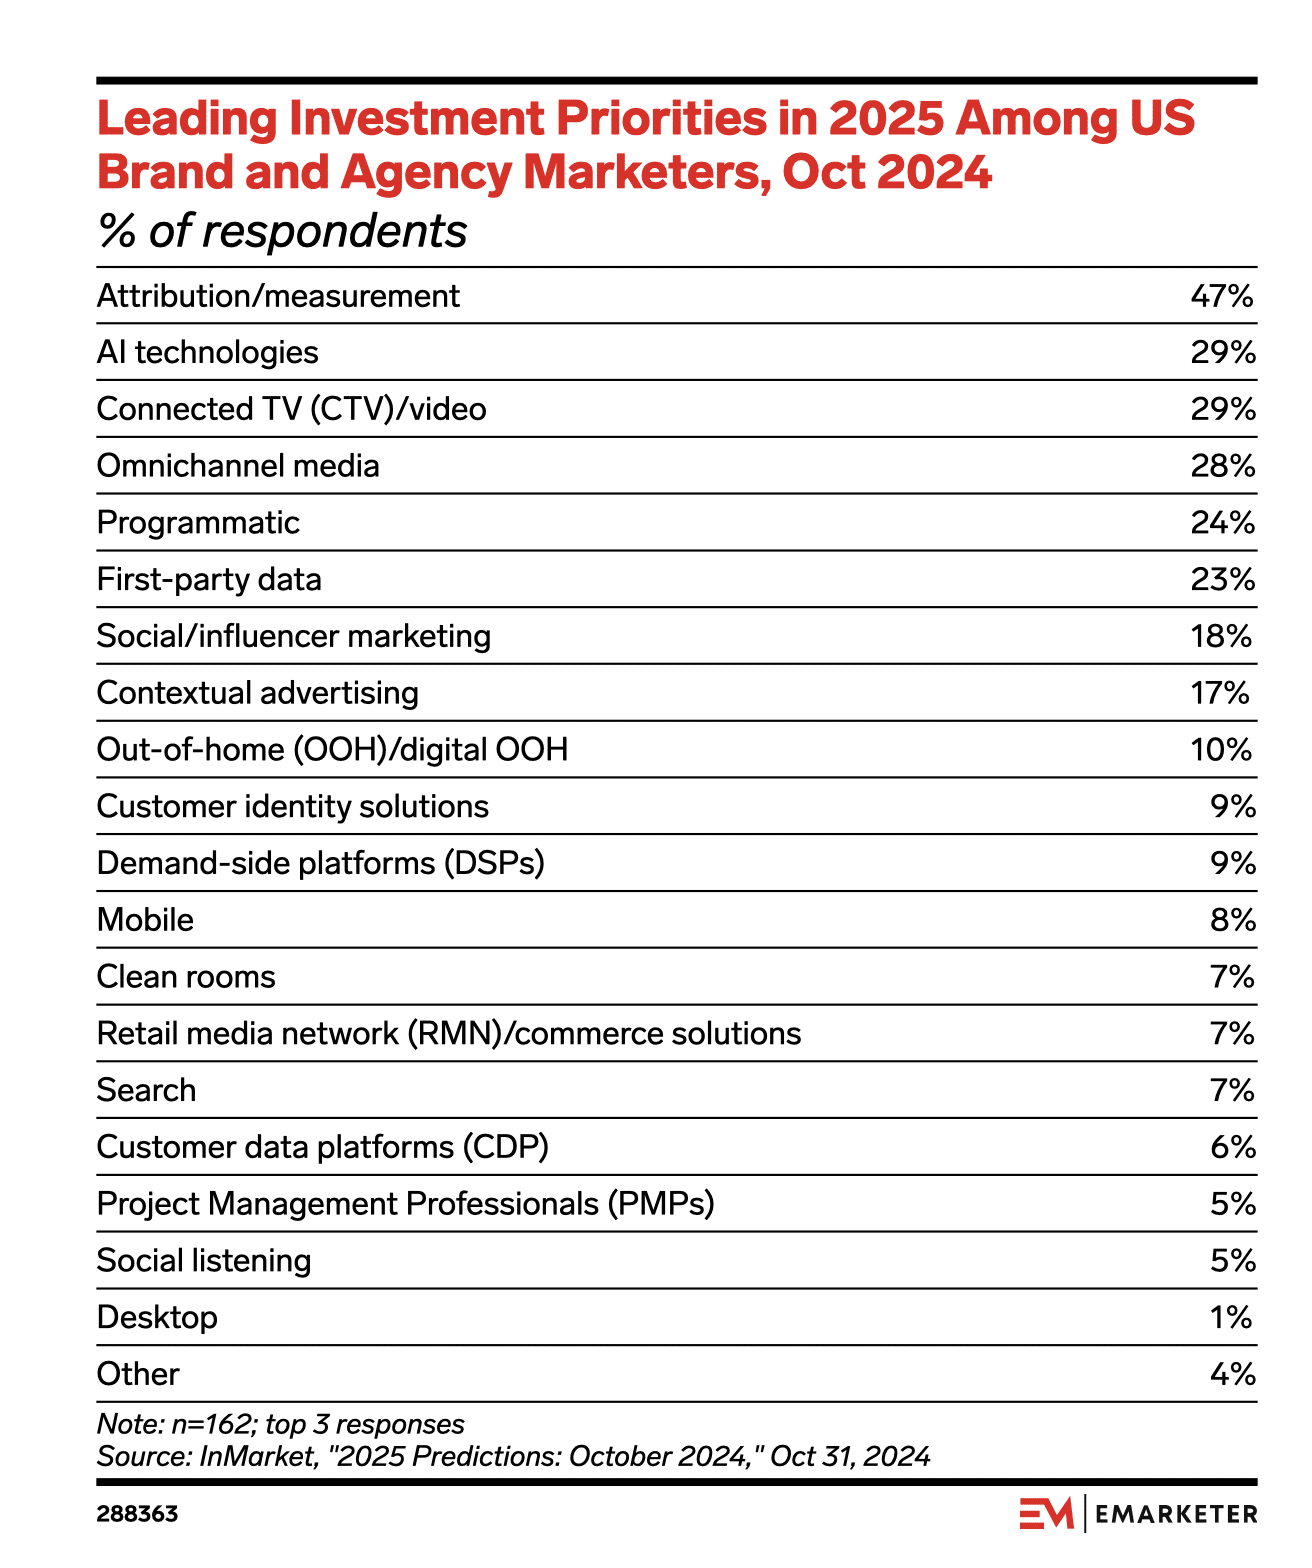
A recent survey indicates that majority of the marketers are setting out to seek this Utopia in 2025
2. There is no “definitive” solution
But that’s not the end of the world. It’s not all dystopian.
Measurements is the process of causally inferring the true incrementality offered by various business initiatives or interventions
To build the right intuition about incrementality and causality refer to these blogs :
Intuitive Incrementality – https://docs.google.com/document/d/1AvjkW7ODZfPHU80BHKhrk30HsPJm9mnG2I5xAjZH-Cs/edit?tab=t.0Causal Thinking for Decision Makers – https://docs.google.com/document/d/1KenjwA02EVGUKtt9vuATlBSYmpFo8lWdMnYiwlsC3XE/edit?tab=t.0
Every marketing measurement problem is an endeavor to find the solution to an equation that looks like a version of this :
a1 x facebook + a2 x tiktok + a3 x google branded search + a4 x promotions + … + <some error> + …. = Total Sales (or whatever)
OR, rather more like this one, if you will
a1 x (even more transformation(some transformation(facebook)) + a2 x (even more transformation(some transformation(tiktok)) + a3 x (even more transformation(some transformation(google branded search)) + a4 x (even more transformation(some transformation(promotions)) + … + <some error> + …. = Total Sales (or whatever)
Attribution, MMM, Experiments, and everything in between and beyond attempt to solve this equation, or find reasonable values for the coefficients, in their own unique ways—each from different vantage points, perspectives, and with their own inherent limitations.
But, at the end of it, this is the syntax of the magic that we all seek – more or less.
( At the most abstract level, perhaps the question is even more philosophical – Could we ever get a coefficient that tells us what, say, a facebook native ad could drive in dollar value to our business, incrementally, today and the day after and the day after? And could we get this right for now, for last year, the year after and for years to come? )
In the last section we spoke about marketing measurement being a nondeterministic problem. The practical way to approach such problems is to seek probabilistic solutions using stochastic models that incorporate randomness in the modeling process.
Most of the real world problems are stochastic and non deterministic.
In the world of attribution, debates abound over different methodologies—such as single-touch, multi-touch, Shapley attribution, logistic attribution, and many others. At its core, the question revolves around how to assess the contribution of each channel to conversion. This is treated as a problem of determining the aggregate weight of exposure for all converted users from each channel, based on various rules or algorithms.
Ultimately, what we obtain from this approach are :
- Coefficients that “fit” well on historical data but lack true explanatory power.
- Data that reveals a lot of correlated patterns, but an approach that cannot distinguish spurious correlations from meaningful ones
- Moreover, these models have no ability to predict future outcomes.
So, the question remains – what’s the whole point ?
In the MMM world, debates—often fiercer—rage over frequentism vs. Bayesianism. While some of these discussions are enriching and informative, most are academic exercises (and I have great respect for that), with limited practical utility for the marketer who is waiting with dollars, unsure of where to spend. Typically, any MMM is built on only a few hundred observations (a few thousand if one can run hierarchical or mixed-effects models across different dimensions). Given this, how could any algorithm magically infer everything that needs to be inferred from data that is, by nature, extremely limited?
Frequentist Vs Bayesian
There is an easy test to know if you are a Frequentist or a Bayesian.
Answer this question: I have a coin in my hand, if I toss it what’s the probability that I get tails?
(Take a few seconds, if you want. I have asked this to 10 people – none of them are qualified statisticians, but everyone of them were STEM undergrads)
If your answer was 50% – You are a Bayesian!
You had a “belief” that “fair coins” will give Tails/Heads in equal probability.
[ Though none of them asked the clarifying question of whether the coin was “fair”. They had a “belief” in the fairness of every coin there is ]
If you were a frequentist, you would have answered – I don’t know! The only way for a frequentist to know the probability of a coin showing tails is for them to first toss the coin, say, 10 times. They will then count the number of tails (i.e. the relative “frequency” of tails, hence “frequentism”).
[ Courtesy – Cassie Kozyrkov. https://youtu.be/GEFxFVESQXc?feature=shared ]
Let us say we toss this coin 10 times and it gives 8 tails and 2 heads.
Now,
Frequentist : Probability of tails is 8/10 or 80%
Bayesian : Probability of tails is 75% (Note – Bayesian started with a “wrong uniform prior” of 50% or .5, and now stands close to the truth(?) that the coin is actually not fair and in every iteration, his posterior moves closer to the “possible” truth of .8)
Let us say we repeat this exercise 10000 times and we got 6510 tails.
At this point both frequentist and Bayesian (who started with a wrong prior) will estimate the actual probability of tails at .65 (it’ll be .6510 for the frequentist, while it will tend to .6511 for the Bayesian).
So, the conclusion: Given enough data it doesn’t matter if you are a frequentist or a Bayesian. Your worldview will converge to a single answer – If you are still adamant about your initial belief then that’s another problem.
But, the problem is with the availability of data!
Remember, MMM – which is the playground of this debate, at least for the purpose of this blog – is a small data, low frequency, low signal problem. What does this mean :
- It does not give enough data (“tosses”) for a frequentist to really know that probability of tails is .65
- It does not give enough observations for the bayesian to correct their prior – if they had started with a wrong prior
- And to make things even worse, you are not interested in the outcome of one coin, but many coins together (think of all the variables that go into the model) where each coin can have a range of outcomes instead of heads or tails
There is a lot of merit in this debate outside of the context of MMM. Bayesian stats is deployed and has shown “applied” value in a lot of scenarios where frequentism could not be tried, while frequentism is at the foundation of the inductive process on which modern science is built (let’s overlook p-value controversy for the time being)
During COVID-19, many pharma companies were rushing to release their versions of the covid vaccine. Pfizer used Bayesian statistics to measure the success of their clinical trials, while Moderna used frequentist statistics. When we received our doses of these vaccines, all we cared about was what was available to save our lives, not whether we were Bayesian or Frequentist.
So, coming back to the Pursuit of Utopia.
The solution for the measurement problem lies in a Framework – A set of processes that acknowledges the real world limitations and is rooted in practical application – not in sophisticated algorithms (alone) or in mathematical rigidity.
[ This is a paradoxical statement, I know – while marketers are increasingly encouraged to think probabilistically and apply statistics at work, here we are also warning against the pitfalls of modeling ]
In the next section we will take a deeper look into the solution. But, before diving into it, it’s important to establish the intuition behind what an effective solution should offer across various levels of marketing decision-making.
| Decision Level | Nature of Solution | Speed |
|---|---|---|
| Strategic | A system designed to capture the interplay of all controllable marketing levers—paid, owned, and earned media—as well as contextual business drivers like pricing, promotions, partnerships, product launches, and offline events. It should provide a unified view of how these factors contribute to long-term business goals such as profitability and growth. The system must include predictive (forecasting) and optimization capabilities to support decisions related to budget mix, KPI targets, and strategic initiatives. It must be robust enough to inform quarterly decisions, while being monitored for model drift and recalibrated using experimentation outcomes. | Slow(Reviewed quarterly, monitored periodically for drift and updated with new data and/or calibrated with experiments) |
| Tactical | A solution focused on evaluating and adjusting the allocation of resources at the channel or tactic level. It should provide monthly-level performance insights, enable scenario planning, and identify opportunities to scale, maintain, or reduce investments. The system should support creative and messaging strategies across key audience segments. Forecasting at this level should support medium-horizon planning and allow agile responses to performance trends. | Medium
(Reviewed monthly or bi-weekly to support agile planning and budget adjustments) |
| Operational | A real-time or near-real-time system designed to support daily execution decisions. This includes fine-tuning campaign-level budgets, adjusting bids, testing creatives and audiences, and reacting to immediate performance signals. It should enable continuous experimentation and learning loops, with actionable insights surfaced quickly to optimize daily operations. | Fast(Reviewed daily to weekly for rapid iteration and optimization) |
And what’s this Framework that addresses all these decision needs ?
Lo and Behold : Unified Measurements Framework.
3. Solution is a Process (and Not just Statistical Wizardry)
Unified Measurement Framework
This part of the story has two parts
- The Process of Triangulation
- The Process of Continuous Improvement ( & Continuous Accountability)
A. The Process of Triangulation
The misunderstood Triangle
Let me first introduce The Triangle – which, anyways, is all over the internet
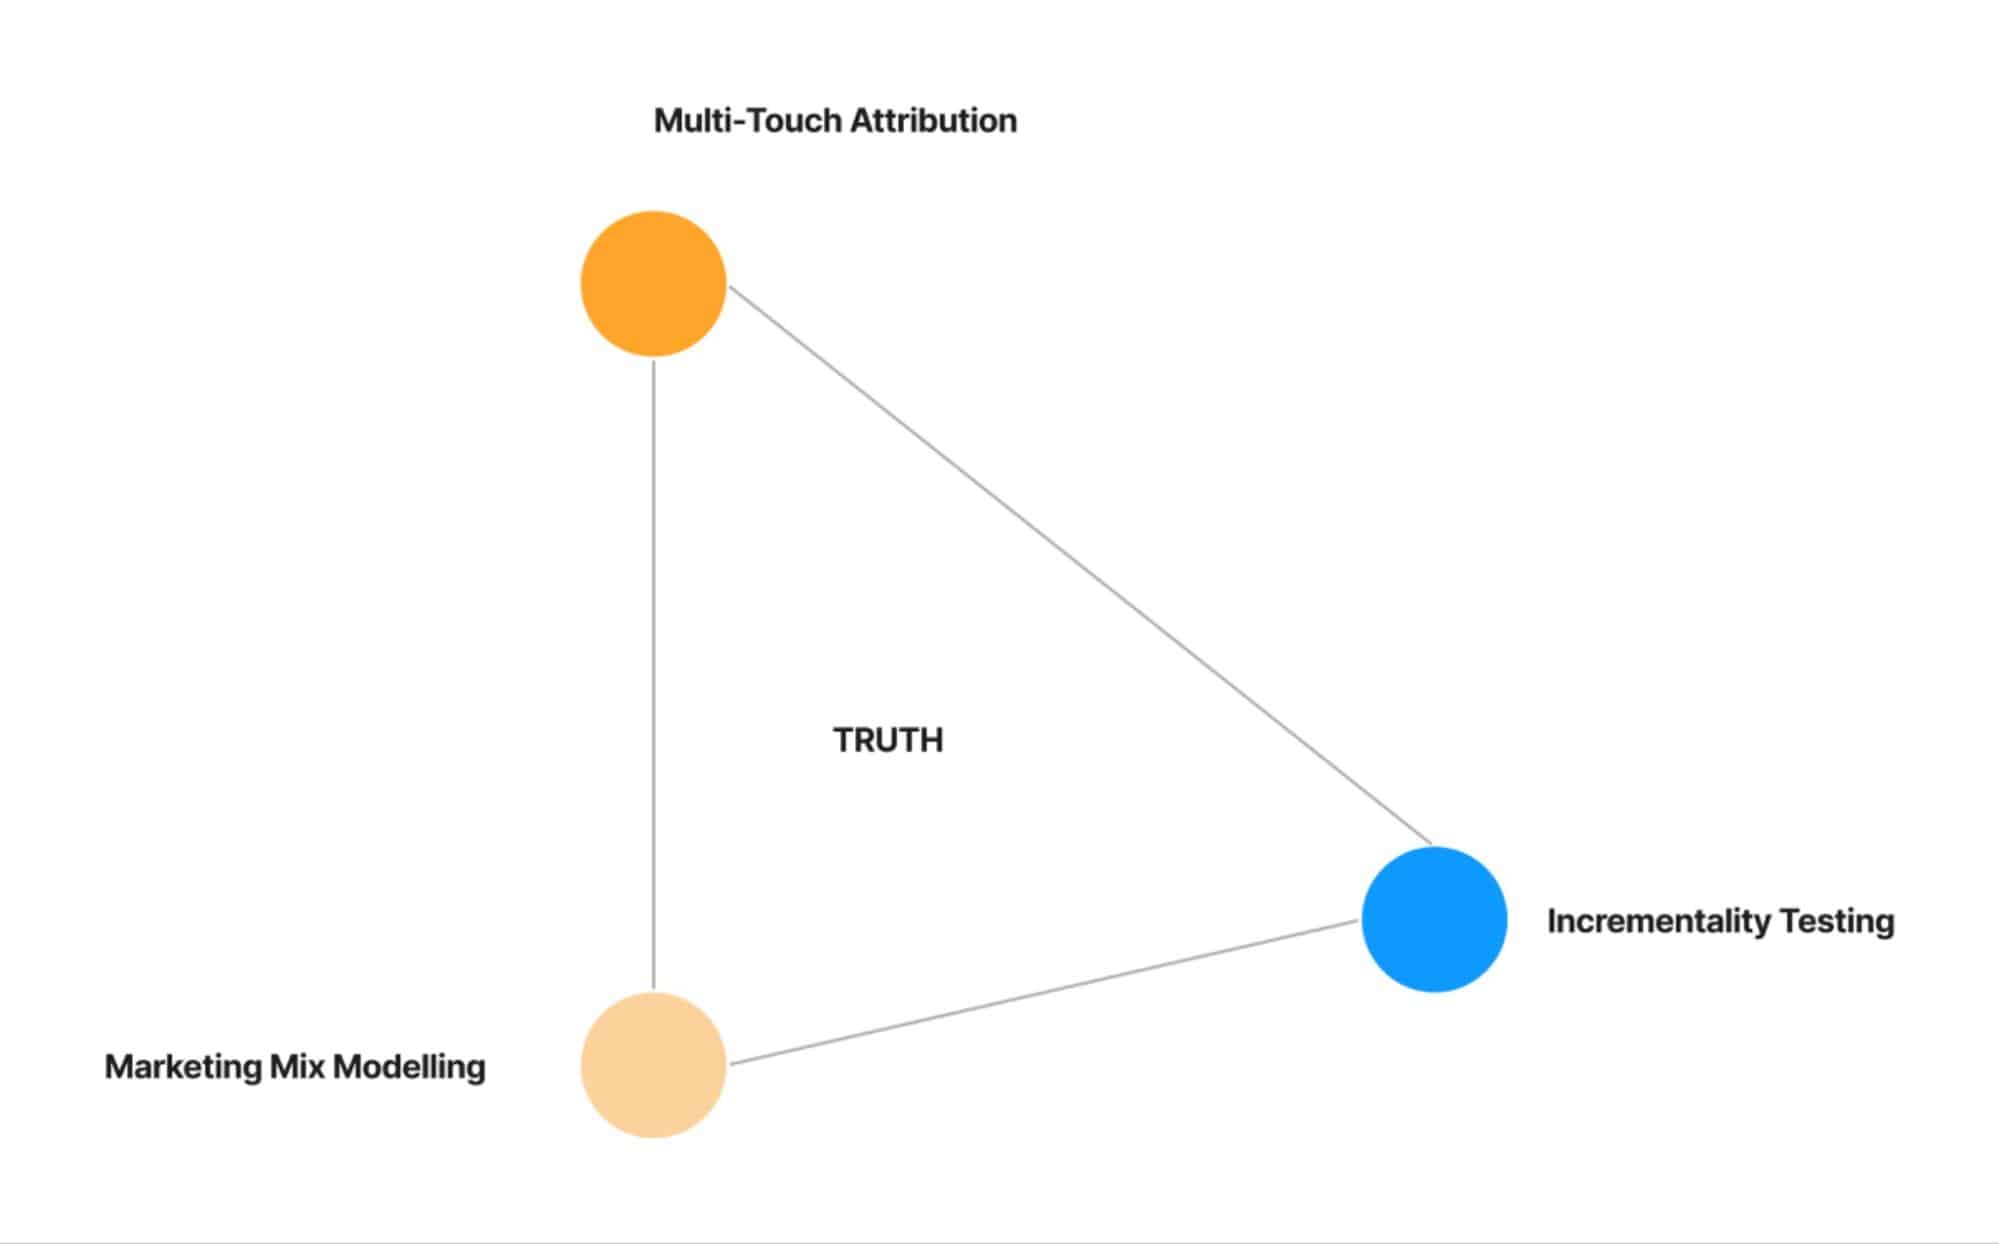
Courtesy: Lenny’s Podcast
In the conventional sense, all the marketers and marketing organizations I have spoken to over the past year have understood (or, if they have tried to understand, at least in part) triangulation as a way to compare Attribution, MMM, and Experiment numbers by placing them side by side to see if there is any agreement between them – whatsoever.
There are a few very important things to keep in mind here
- One shouldn’t expect any agreement between these numbers as these are different methodologies, trying to quantify different things and reporting different metrics – while some are granular, some strategic, some measures only immediate, while some measure temporal & average effects over a period of time etc.. – Only explanation for any agreement would be some cosmic level coincidence
- You don’t need a Unified Marketing Measurement Platform to compare these numbers – you can pull it from your attribution , mmm and in platform conversion lift tests separately and compare it in google sheet. ( ofcourse comparing it in one place might be a bit easier, but beyond the 5 minutes of your time that it saves, every day, there is not much value there). So this comparison is not the primary function of The Triangle.
Let us understand The Triangle better – and the unique role of Unified Marketing Measurements (UMM) Platform in the life of this Triangle.
( Note – we have seen a gazillion different versions of this triangle. Ok I am exaggerating. But, many many versions for sure. What you see below is Lifesight’s version. Which we’d argue is the right version )
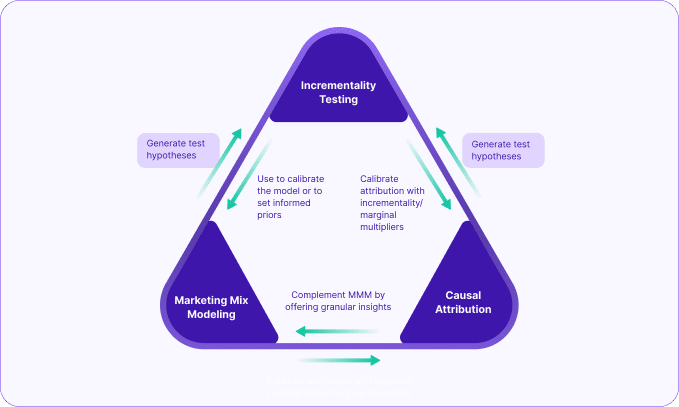
The core idea here is that, if at all you choose to spend all the time in this world running all these techniques and still want to make sense of it and use it, you should integrate them with each other this way, so that they complement each other really well – the whole is greater than the sum of its part!
And this integration is not possible if you don’t have this in one place. Hence UMM!
Going forward we will refer to this Integration as Measurement Orchestration.
[ UMM – 1, Other Attribution Platforms – 0]
What goes into the Measurement Orchestration? Let us dive in.
Marketing Mix Modeling
MMM is perhaps the easiest way to generate incremental and marginal measurements at scale – where impact can also be measured across a range of time periods. Besides this, MMM can also generate good testing hypotheses so that marketers could prioritize what needs to be tested – making sure that they deploy their bandwidth in running the most important tests. MMM can also bring incremental results back from these tests (meet Calibration) and improve itself. [We will see this virtuous cycle many times over from now ]
UMM value: Generation of testing hypotheses, Easy design and Deployment of tests based on hypotheses generated from MMM, Calibration of models, Calibration of attribution, and Deduplication of attribution numbers.
Why does MMM need Calibration? What will it do with it?
Before we dive into calibration, let’s first understand what MMM does. MMM examines data aggregated on a weekly or monthly basis, along with the corresponding outcomes it drives, and seeks to determine how best to ‘transform’ the input variables so that they come together to explain the outcome as accurately and robustly as possible.
These transformations are a key reason why MMM regressions are different from other types of regressions. They enable us to model non-linearity, adstock and lag effects, diminishing returns, and the marginal effects of the input variables.
Remember our measurement formula?
a1 x (even more transformation(some transformation(facebook)) + a2 x (even more transformation(some transformation(tiktok)) + a3 x (even more transformation(some transformation(google branded search)) + a4 x (even more transformation(some transformation(promotions)) + … + <some error> + …. = Total Sales (or whatever)
Remember all the “transformations” in the above equation? These are ad stock and saturation transformations (while attribution tries to fill in these equations with the exposure-based coefficients, it ignores these transformations. But, for MMM, these transformations are very important)
What MMM model does is randomly try many different transformations by running the data through certain transformation functions. These functions assume a bunch of different things – geometric decay, slow rise, and then a steep fall, steep rise followed by a slow decay, and a bunch of other options for adstock. It also assumes a few special transformation shapes for saturation as well, such as C-curve or S-curve. (The order in which these transformations need to be applied is the topic for another day)
But, how do we know what’s the right transformation? We don’t really! So we try a lot of them. But, we have limited time and money and compute power and we have campaigns to run. So, we try this long enough till we are reasonably sure that the right transformations we need are there somewhere among the tens of thousands or hundreds of thousands of models that this process generates.
After this point, we run a bunch of validation, quality tests and simulations to pick the right model or model(s) that fits the data best and gives us good confidence. We will talk about this confidence in a while.
Now coming back to Calibration – So, why Calibration?
The process of “transformations” is a random process. The algorithm walks like a mad man across many iterations hoping to land on a subset of good models from which it can then choose the best ones.
It helps if we could give some guidance to this random walk, a map perhaps, some way to tame the madness a bit.
In Bayesian context, priors give some guidance. It sets the starting point from which the model can begin its roaming while making sure that it doesn’t tread too far away from the normal land. Priors also might set a starting point that’s so far away from the right place, that the model might never find its way to the true utopia.
In the Frequentist approach, we need to set some objectives for the roaming process. For example, whenever you transform some variable make sure that the share of credit you give to a certain variable is not too far off from the share of spend of that variable. Or, be unbiased in giving credit. Or, be both? and so on…
Calibration is just a better guidance system.
Let us take an example :
Say, You have a model built from 1st January 2022 to 30th October 2024.
The model reads average iROAS from Facebook as 1.9x and mROAS is .9x — i.e., though Facebook has given you more than what it took (1.9 times for every 1 dollar invested) over the last couple of years, it has diminished to .9x now…Which means, for the next dollar you invest, expect only .9 back.
You disagree! You run a Test.
Let us assume this test was “Designed” and “Executed” really well – A MAMMOTH ASSUMPTION. And the test result suggests, with 95% confidence, that you have at least 3x return from facebook.
[ Warning – this is the return that you have measured within the testing window. Actual return is always more than this. You can choose to have a “cooling off” period after this to continue measuring the impact – but this is harder than one thinks, because you need to continue your control even through the cooling off period. But, let us revisit all of this later. Going back to Calibration ]
So, what do we have here?
- We have an MMM model which gives Facebook 1.9x credit and pegs its current efficiency at an mROAS of .9
- And we have a more accurate and causal test result which says Facebook is capable of giving 3x (of immediate return, at this point in time)
So, perhaps MMM wasn’t entirely fair to Facebook. The ‘mad man’ algorithm may have strayed too far from Facebook, despite any initial guidance it had. It could certainly benefit from better direction. And that guidance comes from calibration. Through calibration, we inform the model that we have good reasons to believe Facebook is under-credited by MMM.
Let’s not focus too much on how calibration is applied—there are challenges, debates, and multiple approaches. However, in the end, it offers some guidance to the model parameters. When you calibrate the model, it runs those thousands of transformations again, but this time, with each iteration, it checks whether it’s moving closer to or further from the test results for the test window.
Now, what will happen as a result of Calibration? Will we have a new model which will read Facebook iROAS as 3.5x with mROAS as 3x and do we get to live happily ever after?
Not so fast. We have given better guidance for sure, but the model is still limited by the data it sees. It’ll finally go with the data. The end result, should ideally, come close to what was calibrated for – but it might not.
A calibrated model will still show averaged-out results, but it might not still agree with experiments. In the world of UMM Platforms, this agreement is not a big deal. We have ways to make sense of both and take actions based on both.
There are cases where MMM coefficients are fixed or frozen based on experiment results – even worse for specific testing periods. This is not something that we are in favour of. MMM has its purpose, one need not try to get MMM confess whatever they want it to. Besides the calibration, UMM should still be able to honour MMM (calibrated or not) or Experiments or Both in letting marketers make their decisions.
[ UMM – 2, Other Attribution Platforms – 0]
Incrementality Testing
Incremental testing aims to create a controlled environment (think control) with randomly selected (think randomization) cohorts of treatment and control test elements – hence, Randomized Controlled Trials. In geo testing these test elements are States / DMAs, whereas in split testing these are profiles. (Time testing is another promising approach that is identity agnostic and can be applied to channels that do not have geo level controls – Though it has its own set of challenges).
Experiments quantify lift (between the control and treatment groups) and allow us to measure incrementality with greater confidence. They measure the lift in the present moment. However, experiments need to be stopped at a specific point in time, which means the carryover impact beyond that point requires adjustments (or is often ignored, or is assumed).
UMM value : Run the right tests and run them well. Experiments need to be understood for their power, their robustness and their right execution. Interpretation of experiments also has some nuances which makes sure that we do not underestimate them. Use experiments to calibrate MMM Models, Calibrate touch based attribution and deduplicate platform attribution numbers.
(For the purpose of this blog, we limit our discussion only to Geo Testing – However Lifesight’s UMM platform supports geo and split testing and is soon to launch time testing)
Why are Marketing Experiments not Causal, but Quasi-Causal?
Do marketing experiments deserve the same respect that we give to Randomized Control (clinical) Trials? Yes and No.
Let us first look at RCTs in the context of clinical trials itself : If a medicine fails to kill you, it might appear as if it cures you – thanks to immunity. So, how will one really know whether it’s the pill or the innate immunity that cures you of your illness? Sounds like an attribution problem?
Galen is believed to have said this about a remedy of his : “All who drink of this remedy recover in a short time, except those whom it does not help, who all die. Therefore it is obvious that it fails only in incurable cases.” ( He seems to have done a last click attribution based measurement based on user level data. )
But, that was 200 CE. Now we have better methods – RCT.
This is how it goes : We randomly pick a group of people, separate them into two cohorts, give placebo to a set of people (control group), and give the actual medicine to the other group (treatment group). We assume a Null hypothesis that the intervention won’t create any meaningful difference between the two groups. We wait for some time and see if there is in fact any meaningful difference. We run it through some high-school level statistics to see if we have a result of statistical significance to reject or not reject the null hypothesis. (Frequentism and Bayesianism debate is relevant to this statistics also. As we mentioned previously how pfizer and moderna used different statistical approaches in their clinical trials)
Now, this does look quite casual, doesn’t it? But, the main problem in replicating this process in the context of marketing is that there is no laboratory where we could test the efficacy of Google cpc or Facebook prospecting and what could be the placebo by the way?
[For rest of the discussion, let us specifically look at the example of geo testing – while points discussed are mostly general and applies to all types of testing ]
Problem 1 : Randomization.
Randomization does not mean that you randomly pick a few people and assign them to control and treatment groups. “Random” has a precise meaning in statistics. Randomly selected test subjects in the sample should be ‘similarly’ distributed as in the population.
For example, if the population has a male:female ratio of 1:1, the sample also should have the same. If the population has a specific ratio of ethnicity, nationality, age groups, the sample also should ideally have the same/similar composition. Else, randomization is not random enough. In extremely controlled studies such as in clinical trials, randomization is a long drawn process and can be managed properly. In the marketing context, however, this is notoriously hard.
In geo tests, randomization is the process of picking a set of states/cities in the control and the treatment groups in such a way that the control group could be considered as the counterfactual (people who were given the placebo).
Problem 2: Control.
When we are testing a particular intervention on the treatment group, we need to ensure that the rest of the variables are maintained at status quo levels. This is difficult, impractical, and near impossible in the real-world marketing context.
[ In any case we will have to tolerate a narrow range of variations in the values of the other control variables and discount their impact on the test results ]
There are also spillover effects and lag effects that we will fail to incorporate or simply overlook while interpreting test results from geo-testing.
To address the above listed problems, geo-testing adopts certain algorithms for randomization and control. Lifesight uses the approach of Synthetic Control Method to address these issues. ( Other popular methods are regression and DiD)
Experiments should be Robust & Powerful – Are Yours?
Let us look at a fictional test:
A brand is spending a million dollars a month across 6 platforms and they typically drive 3 Million dollars in revenue (blended ROAS of 3x) in a month. They now want to test a new platform. Let us call this platform X (I didn’t mean the X, just some X). They wanted to test the impact of this platform and they scaled investment in the platform to 50,000 USD over a period of 2 weeks and waited for another couple of weeks to complete the measurement.
They noticed that they see a change in revenue by 1 Million USD (i.e now the revenue is 4 Million dollars for the test month). They are super stoked. Additional 1 Million dollar revenue was attributed, incrementally, to X. And an iROAS of 1,000,000/50,000 = 20!
What went wrong here? Many things.
- For one this was not a geo test, this was a time test. We were comparing revenue differences between two different periods against the change in spend across two different periods. This adds seasonality into the equation. These time periods could mean different things for the business
- Was the scale up test of 50,000 USD in a new platform even meaningful enough to make a detectable change in your business (which was already at 20x that spent from other channels)? If yes, what were the chances?
- Given points 1 and 2, was one month a good enough period to start with – where the test was for 2 weeks and the cooling off period was for 2 weeks?
Where does this take us: the brand has spent 50,000 USD to test waters with a new channel and has made a completely wrong inference of high incrementality and proceed to scale this channel up with a lot of confidence. Recipe for disaster.
What should ideally be done?
Step 1: Run your scale up^ test in a few geographies (say, states) instead of the whole of the country
Step 2: Be smart about finding these geographies – look at your historical revenue data for a stable period, preferably also covering your test months in the past and find treatment clusters of markets and control clusters of markets based on how similar they are in driving business for you.
Step 3: Run power analysis across all these test-control clusters to test a specific target incrementality^^, and rank them from highest to lowest power (also keep an eye on the combination that has the lowest Minimum Detectable Lift and the Lowest Opportunity Cost)
Step 4: Pick the test with right power and lowest opportunity cost and deploy it
Step 5: Follow the test control as tightly as possible for the test duration^^^
Step 6: Once the test is complete, upload new data and compute the lift numbers.
Step 7: Accept / Reject the test.
Step 8: On acceptance, test results will calibrate MMM (in the next refresh cycle) and will immediately calibrate/deduplicate attribution numbers
^ Evaluate the test type based on the current state of the channel. For newly launched channels, scale up is the only feasible test. However, for more established channels, once could perform hold out tests also.
^^ You need to run longer and costlier test to prove/disprove extreme cases, such of very high incrementality
^^^ Ideally perform multi cell test whenever possible – so that we could make multiple inferences from the same duration
[ UMM – 3, Other Attribution Platforms – 0]
Multi-touch Attribution
We have spoken a lot of Multi-Touch Attribution already. Love it or hate it, it’s the only way in which we can measure granular, sparse, and fast moving numbers at ad set and creative levels – wherever possible. Multi-touch attribution tries to collect as much user-level data as possible, from first, 2nd, and third-party sources and try to group them together to build unified journeys. It understands and quantifies how much data was lost in the process and applies a credit allocation algorithm on top of whatever is available. Attribution can add certain sophistication into how it incorporates aggregate view through numbers in understanding its impact in driving outcomes (or in understanding, relatively, how much extra credit should go to a platform for delivering all those anonymous impressions)
UMM Value: Fluctuations in attribution numbers can generate testing hypotheses. Attribution gives granular and operational context, which is otherwise difficult from MMM (which is a more strategic planning tool)
[ UMM – 4, Other Attribution Platforms – 0]
How Accurate is Very Accurate?
“When a measure becomes a target, it ceases to be a good measure” – Goodhart’s Law.
We are nearing the end of our pursuit of utopia. By now you would have realized that the utopia in the strictest sense of the word does not exist in the universe of marketing measurements – but we still have good workable solutions in UMM (let us call it quasi-utopia). How will one realize that one has reached the best quasi-utopia there is ? Can we recognize one, when we see one ?
This is as tricky a question as all the questions we have come across in this write up so far. Let us try to answer this in terms of “Accuracy” of the model that we have built, shall we?
Let us look at an example.
In a population of 1 million people, 4% of the population has a specific disease. We need to build a model that takes some attributes of every individual as input and predicts if she has the disease. But let us say we just created a program that always returns NO as output. On an average, this program will be 96% Accurate. It’ll pass the accuracy test ! Because if we randomly pick 1000 people from the population we will get 960 correct predictions of NO. This is where we need to think about other metrics of goodness, such as precision, sensitivity etc… The above example was that of a classification problem and we cannot apply these metrics directly to MMM which is a regression problem. But, the point is, accuracy and confidence are always misused.
One should look at “accuracy” a bit more holistically.
MMM can also show high accuracy this way. It just needs to memorize the historical data (after all, it only has to memorize 1000 rows of data at max, which is child’s play for any machine), this way it’ll have 0% error and 100% fit. Predicted Vs Actual will be exactly the same. However, such models will fail as soon as they see new data because one cannot memorize the future. This is where we should use a combination of metrics to understand the right accuracy.
The most popular metric for accuracy is R2 – while we focus on training R2, it is also essential to keep an eye on test R2. Along with R2, keep an eye on estimation errors (across testing and training accuracy) and also test the model on some new data – at least over 2 to 4 months – before trusting the model with your life.
(We also recommend adopting MMM recommendations conservatively or partially (i.,e in certain geographies) till we develop enough confidence on the generality of its recommendations and insights)
[ This is an interesting article on accuracy , overfitting and goodhart’s law – https://sohl-dickstein.github.io/2022/11/06/strong-Goodhart.html ]
Models Drift
Building an MMM model is just the first step of a long and , possibly, fruitful journey.
Models need to be refreshed with new data at continuous cadence. Models need to be calibrated with new experiments whenever possible (best is to follow model generated hypotheses) and most importantly model needs to be monitored for concept drift/model drift. This is true for any ML model and not just MMM. As the distribution of input variables change and their inter-variable relation alters, we need to re-validate if the model coefficients as understood before are still relevant. With every refresh of the model, the model’s accuracy metrics needs to be re-confirmed and if needed the model should be retrained or reconfigured and forecasts and plans updated.
B. Improvement ( & Continuous Accountability)
Triangulation isn’t simply about comparing the outputs of three measurement methods and checking for agreement – because in practice, they often won’t align perfectly, and that’s okay.
The true purpose of triangulation is to enhance each method by leveraging insights from the others. To unlock its full value, these methods should ideally be integrated within a single platform, enabling cross-validation, refinement, and deeper insights.
Before we dive into specific use cases, let’s first walk through the UMM process from end to end.
Hang on, we are almost there.
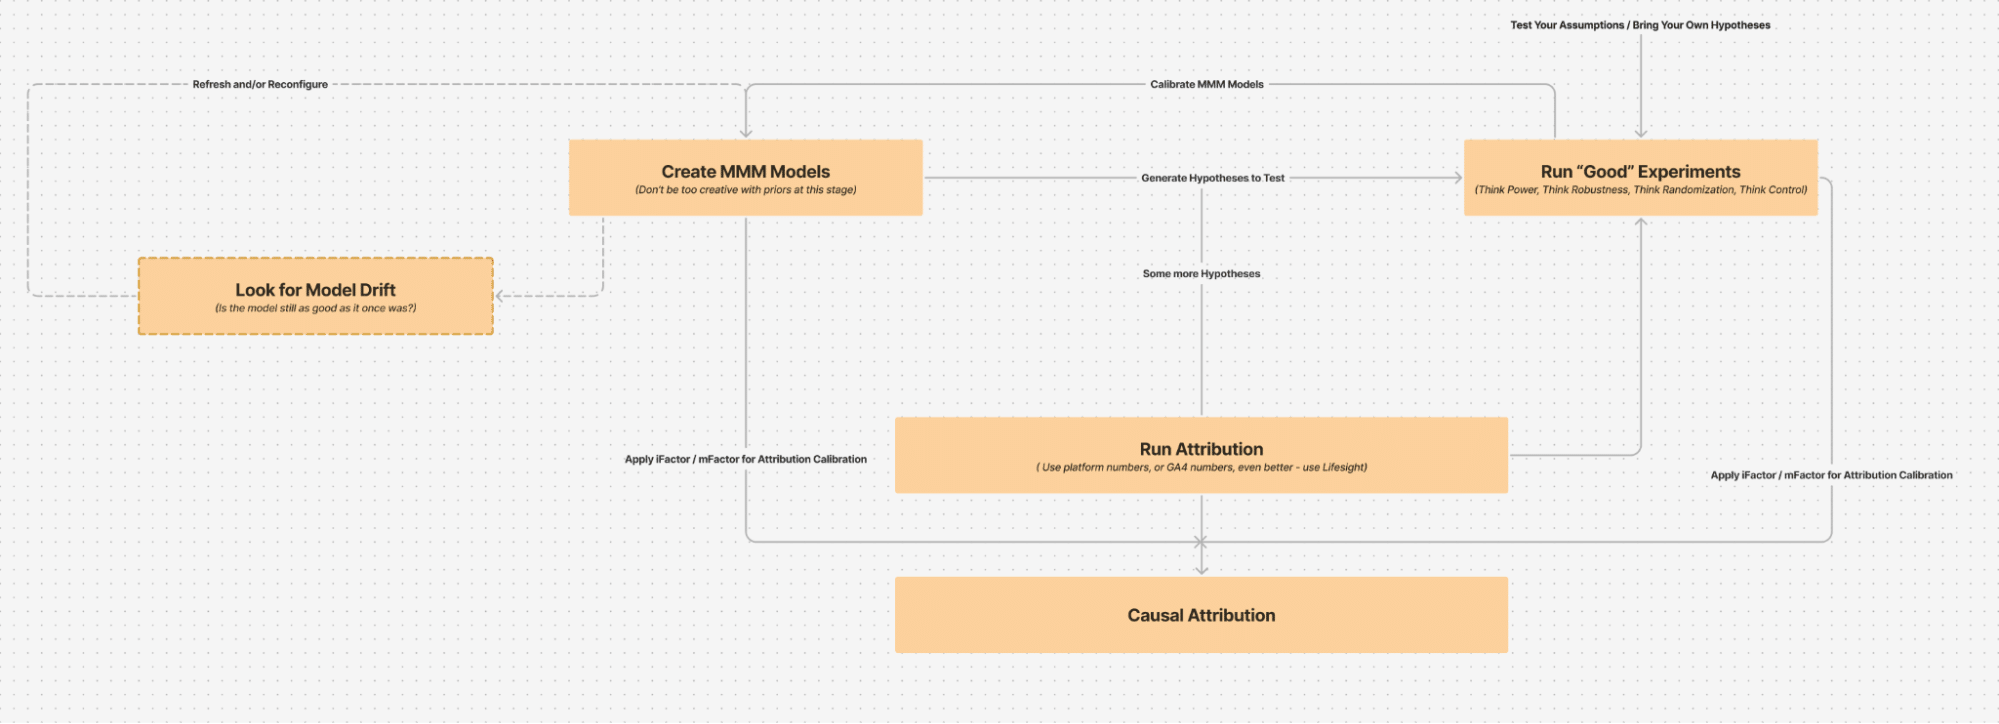
UMM through steps
Step 1: Start by creating the first marketing mix model – easiest way to get your first reads of incrementality and marginal metrics in place. Be aware of all the assumptions that go into the modelling process (in the next section we will list some of the key items to be mindful of)
Step 2: Validate the model by quickly going through its goodness of fit metrics, backtesting/holdout errors and also by quickly checking its forecasting accuracy over a period of, at least, 1-2 months into the future
Step 3: Use model generated temporal iFactor and mFactor and calibrate/deduplicate attribution numbers (pick any anchor attribution. Preferred order is : Lifesight, GA4, Platform reported)
Step 4: Generate initial set of recommendations, including Testing Hypotheses
Step 5: Run some of the most important tests. And run them well.
Step 6: While the tests are running, adopt some of the recommendations from MMM, conservatively, in some geographies (this will enable more feedback to the model)
Step 7: Once step 5 is complete, calibrate the model (also refresh the model with new data)
Step 8: Keep monitoring for Model drift and retrain or reconfigure drifted models
Step 9: Repeat the process and slowly graduate to more “Aggressive” recommendations
Let us zoom out.
Everything that we spoke about in the blog so far is just 1/4th of what UMM Platform offers. This is where it sits.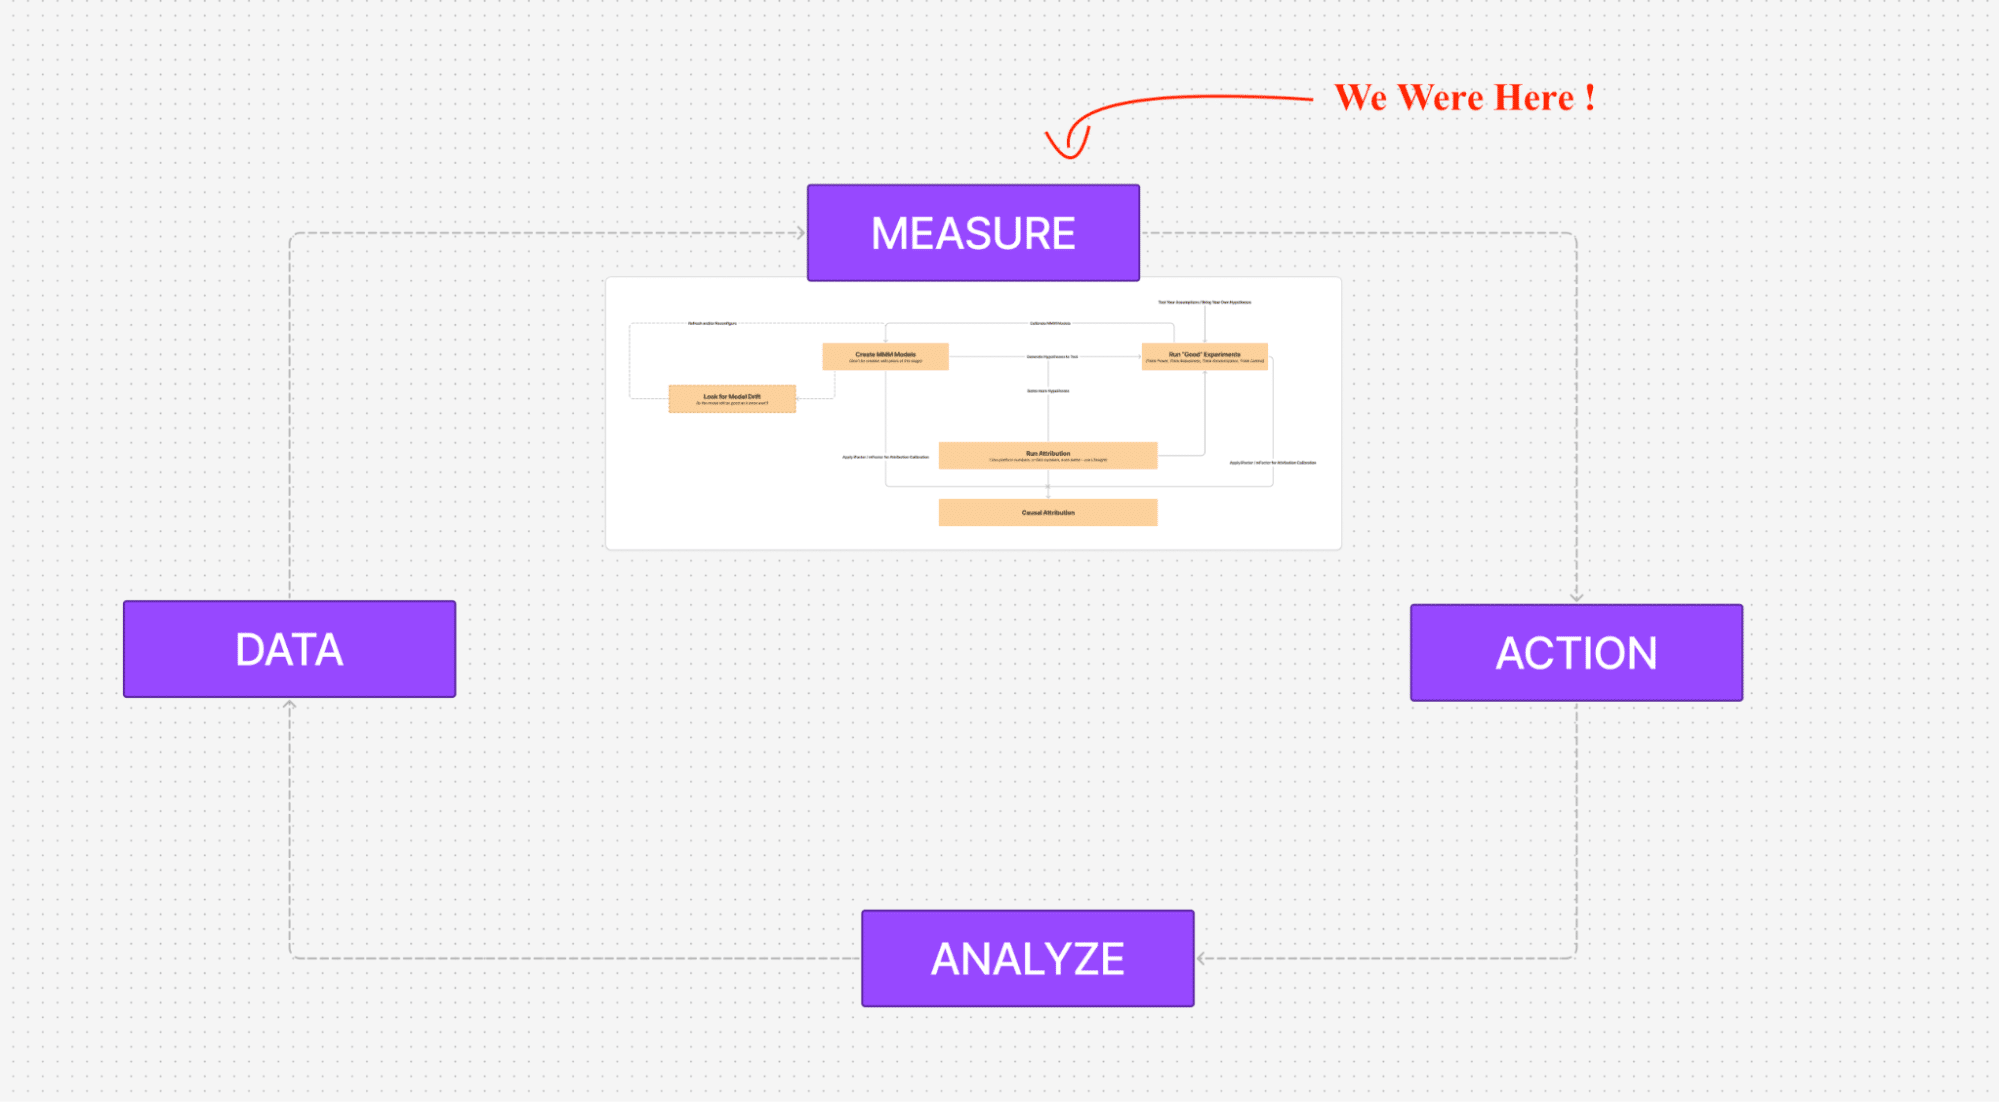
Marketing Measurements is just one of the steps in the cycle of Marketing Optimization. The process starts by building a strong data foundation, applying unified measurements (that we discussed so far) on top of it, using it for manual/semi-automated optimizations across channels, analyzing the outcomes and tracking the goals and continuing the process regularly and effectively.
[ UMM – 5, Other Attribution Platforms – 0]
On the Demon of Analysis Paralysis
A common criticism of the triangulation approach—or unified measurement frameworks—is that it leads to over-complexity and inevitably results in analysis paralysis.
In defense of the triangulation model, here are three key counterpoints:
- It aligns with how marketers actually make decisions.
As we’ve seen, marketers operate at strategic, tactical, and operational levels. A unified measurement approach is designed to support each of these layers with the appropriate level of insight. - Analytics must serve decision-making, not the other way around.
Measurement should always be framed around the decisions it is meant to inform. Unified Marketing Measurement is not complexity for its own sake—it is a structured way to ensure the right data informs the right actions. - Vendors bear the responsibility of abstraction.
It’s not the end user’s job to navigate every layer of measurement logic. Triangulation platforms should abstract the complexity behind intuitive interfaces and decision-ready outputs, making the system powerful yet usable.
Triangulation is just one component of the broader picture. The Unified Measurement Framework (UMF) builds on this foundation by creating a cohesive actioning layer on top of it. This actioning layer should primarily have two features.
Feature 1: Scenario Planner
This offers an easy to use interfaces through which marketers can ask what if questions, generate forecasts and create optimization scenarios for various objectives
Feature 2 : Budget & Bid Changes
This offers a common interface through which marketers can make unified budget & bid decisions across media and ad platforms
When you pick Unified Marketing Measurement Platform to set up your organization’s Measurements Program, you are essentially picking a very broad framework :
- A framework to rethink your entire strategy in terms of incrementality and marginal outcomes – across all levels (i.e., from channels to platforms to tactics to ad sets and ad ids)
- A framework that lets you generate right testing hypotheses, so that you get to build a culture of experimentation in your organization
- A framework that lets you run your tests well and cascade your findings across your marketing teams
- A framework that lets you make verifiable strategic, tactical and operational decisions at scale and with ease
- A framework that could be held accountable for its prediction accuracy
- A framework that learn continuously and keep itself updated
- A framework that is completely transparent in the assumptions it makes to get to the solutions
- A framework that is completely configurable in that all its levers, controls and knobs are available to the marketer to finetune
- A framework that’s an enabler first and a dogmatic blackbox never
[ UMM – 6, Other Attribution Platforms – 0]
References
https://www.emarketer.com/chart/269437/leading-investment-priorities-2025-among-us-brand-agency-marketers-oct-2024-of-respondentshttps://www.linkedin.com/posts/rajeevaravindnair_learning-culture-key-to-measuring-marketing-activity-7254124200972431360-rL4p
https://www.linkedin.com/feed/update/urn:li:activity:7209606265893711872/
https://www.linkedin.com/feed/update/urn:li:activity:7240255097765576704/
https://towardsdatascience.com/statistics-are-you-bayesian-or-frequentist-4943f953f21b
https://sohl-dickstein.github.io/2022/11/06/strong-Goodhart.html?utm_source=pocket_shared
https://www.geteppo.com/blog/bayesian-angels-and-frequentist-demons
You may also like


Essential resources for your success