It is without question that social media has exponentially transformed the global digital landscape in the modern era. With our latest in-depth study, we have encapsulated this profound evolution from 2019 to 2024, which saw the largest rise in visits to social media platforms.
By utilizing SEMrush’s robust analytics, we’ve scrutinized the meteoric rise in social media visits, which peaked at an astonishing 2 trillion in 2024, marking a massive 80% growth over five years that has never been seen before.
Our research highlights the supremacy of platforms like YouTube, Facebook, and Twitter, with YouTube’s visits soaring to 1.35 trillion in 2023, undoubtedly due to the ease of viewing content with the introduction of YouTube Shorts. Meanwhile, TikTok’s phenomenal 60-fold increase epitomizes the rapid pace of this digital change.
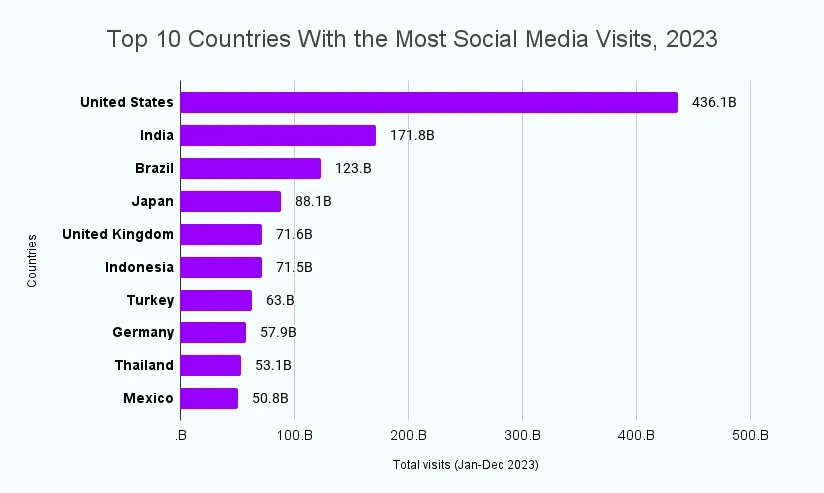
The United States, India, and Brazil emerged as the top visiting countries, showcasing the extensive reach of social media across continents, making this a global phenomenon where nearly everyone is connected.
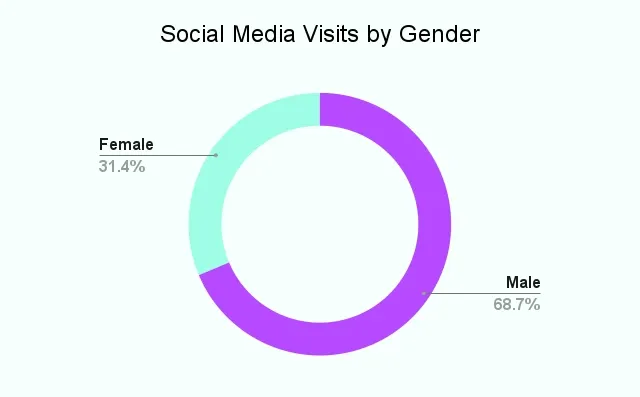
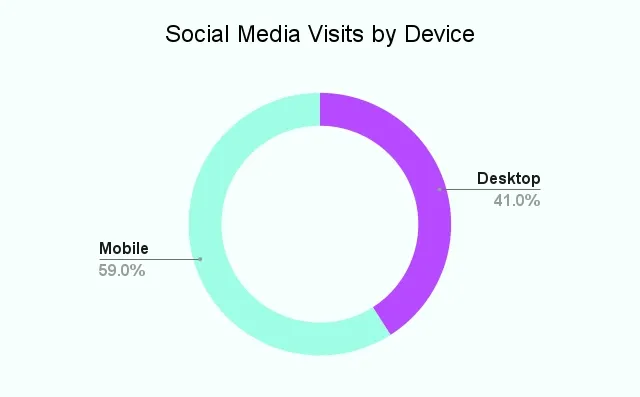
Through our insightful lens, we reveal key findings such as a male-dominant user base and a strong preference for mobile access, reflecting the shift towards ubiquitous social connectivity.
This study is an important gateway and will give you a vital understanding of the current state and future trajectory of social media’s towering influence in the modern age.
Key Findings
- Five-Year Growth: Social media visits jumped from 582.9B to 1.98T, a 70.56% increase over five years from 2019 to 2023.
- 2023 Visit Highs: Combined visits for the top 10 sites reached a record high of 1.98 trillion in 2023 with a global average of 165.0 billion monthly visits and 5.4 billion daily visits.
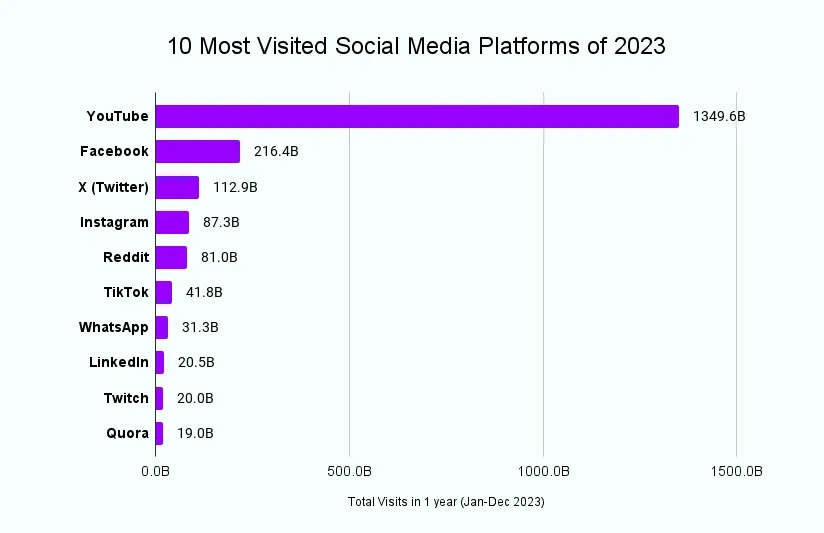
- Dominant Platforms: In 2023, YouTube led with 1.35T visits, followed by Facebook and Twitter.
- TikTok’s Rise: TikTok saw a dramatic increase to 41.8B visits, a growth of 60.15x since 2019.
- Top Visiting Countries: The US (436.1B), India (171.8B), and Brazil (123B) led in social media visits in 2023.
- User Demographics and Devices: Male users dominated at 68.65%, with most accessing social media on mobile devices (59.10%).
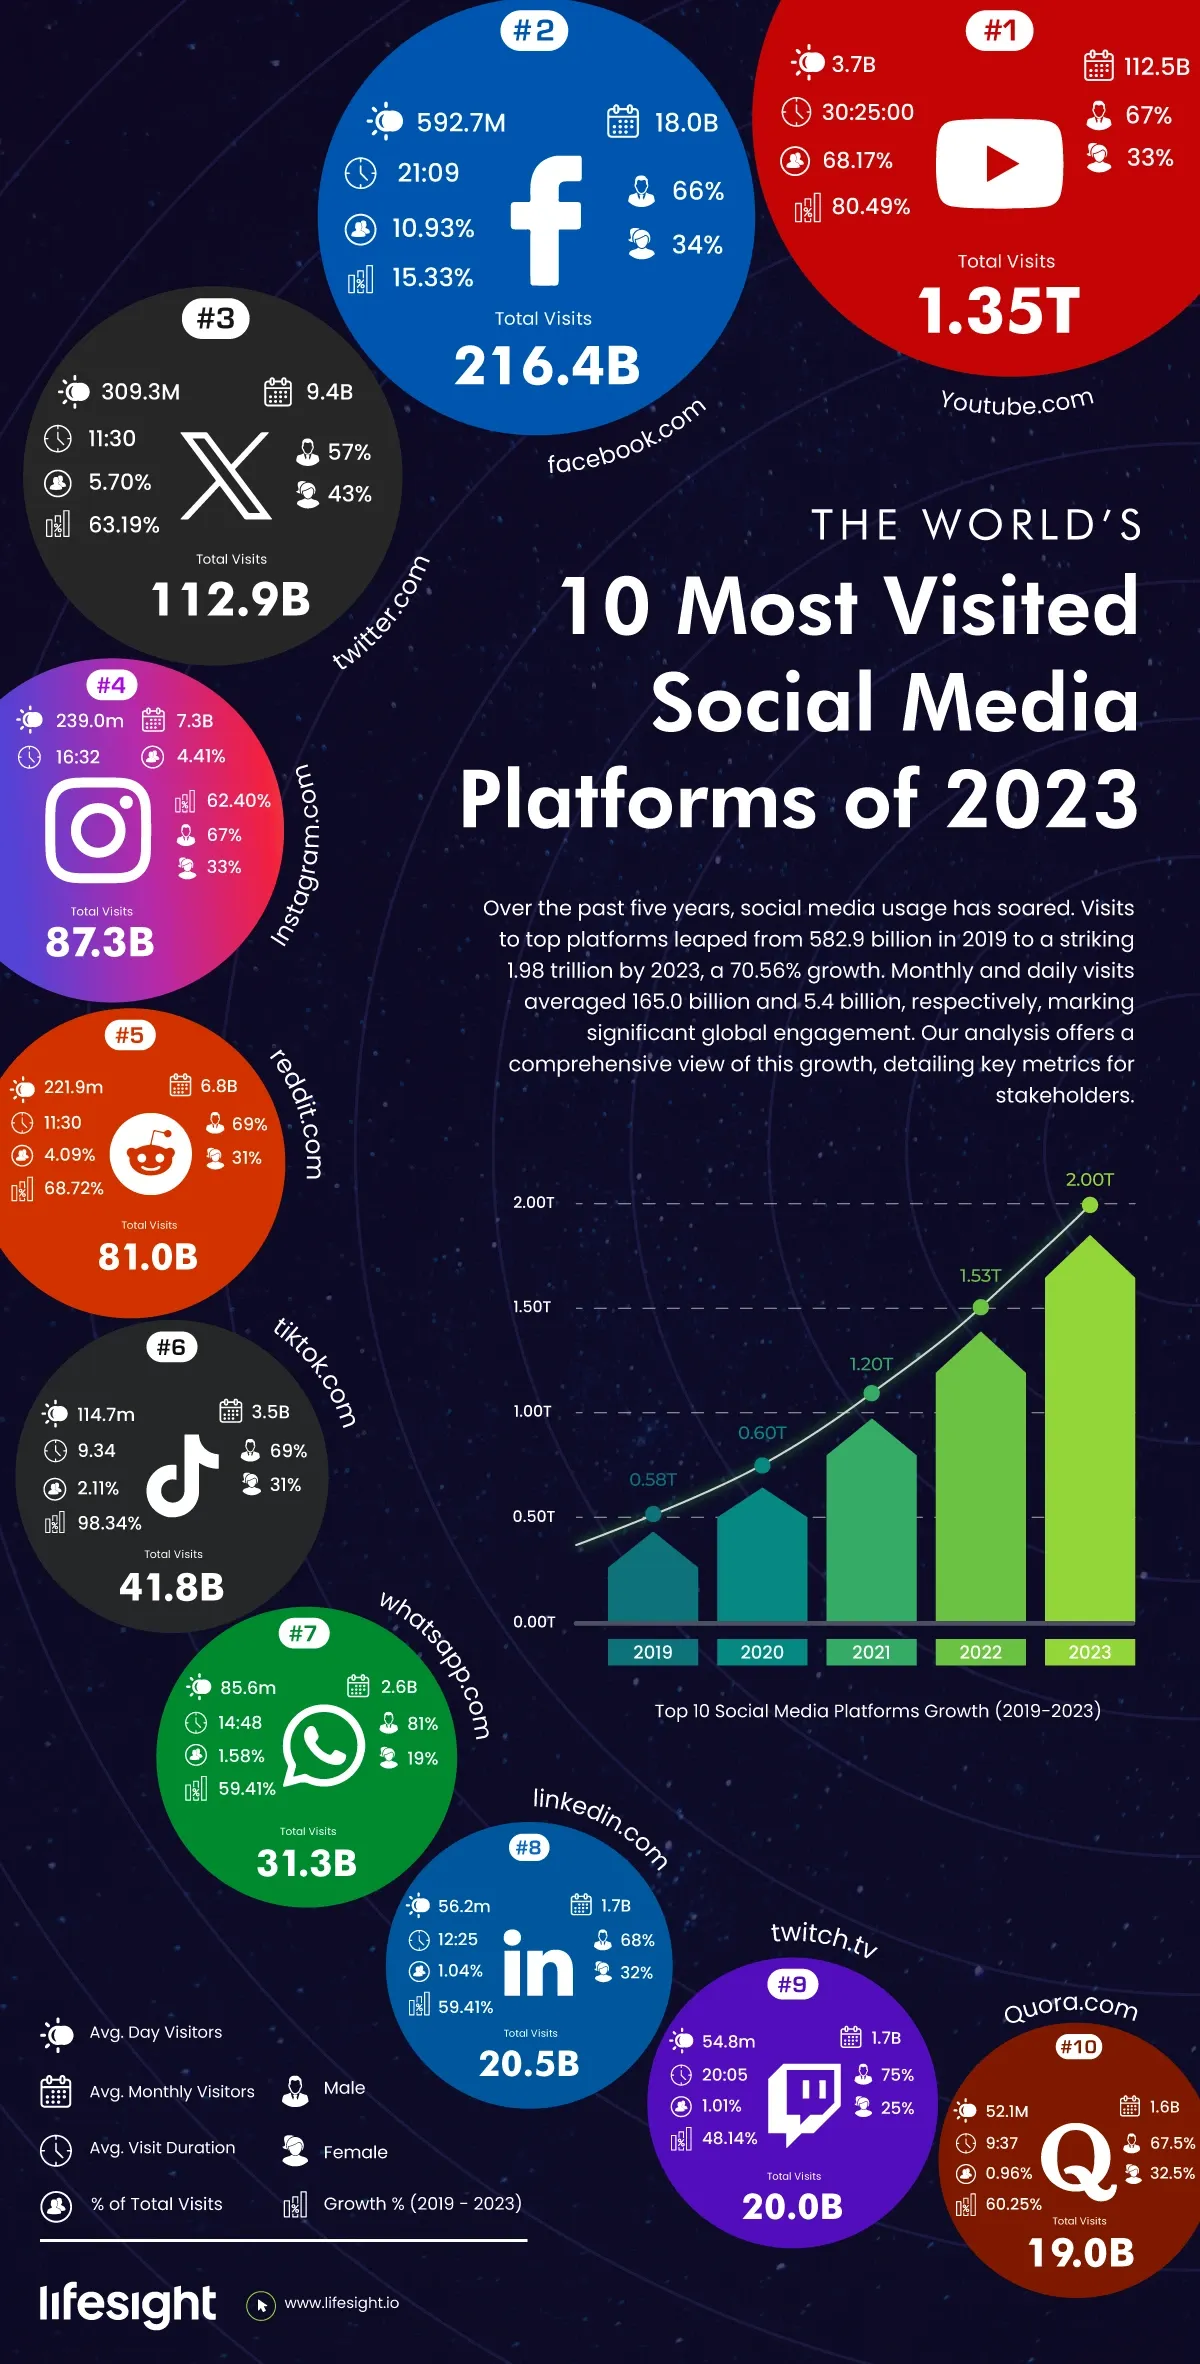
10 Most Visited Social Media Websites of 2023 (Infographic)
10 Most visited-Social-Media-Platforms
Social Media Growth in the Last 5 Years (2019-2023)
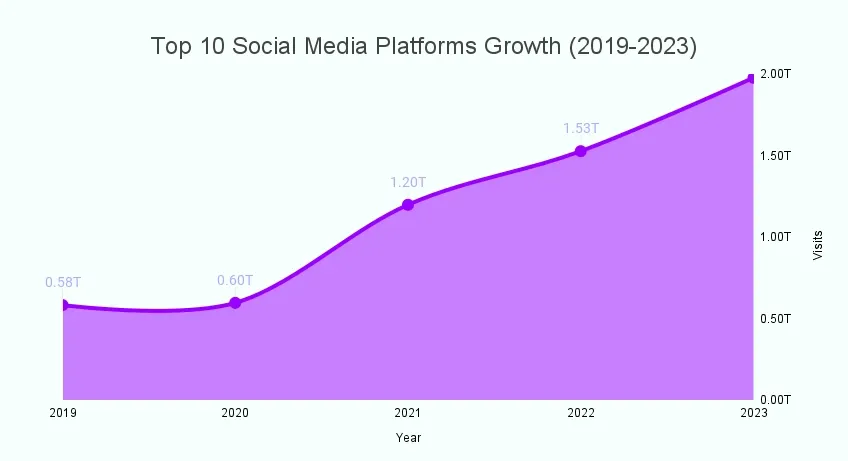
Over the past five years, from 2019 to 2023, we have seen a significant increase in total visits to the top 10 social media websites. In 2019 alone, these sites accumulated a total of 582.9 billion visits. But the numbers don’t stop increasing there.
Top 10 Social Media Platforms Growth (2019-2023)
Year over year brought a steady increase, with a notable surge in 2021, where visits almost doubled from the previous year to 1.20 trillion (no doubt due to the pandemic making people more reliant on their mobiles for entertainment and connection). The growth continued into 2022, reaching an unbelievable 1.98 trillion visits by 2023.
This impressive ascent in 2023 also translated into high global user activity, with average monthly visits reaching 165.0 billion, and average daily visits amounting to 5.4 billion, showing people just couldn’t get enough of these addictive platforms. These figures clearly highlight the consistent and widespread daily and monthly engagement of users across the globe and our constant need for new entertainment.
The total growth over this period was a remarkable 1.40 trillion visits, marking a substantial 70.56% increase from 2019 to 2023. This equates to a growth rate of 3.40 times the original visit count in 2019, indicating a robust expansion in social media use and engagement across these platforms.
10 Most Visited Social Media Platforms of 2023
In 2023, the landscape of social media didn’t take a moment to breathe and continued to evolve with significant changes in user visits across the top 10 platforms. Here’s a breakdown of each platform’s performance over the last five years:
10 Most Visited Social Media Platforms of 2023
1) YouTube
YouTube unsurprisingly retains its position as the most visited social media platform in 2023, with an astounding 1.35 trillion visits, a significant leap from its 2019 count of 263.3 billion. This monumental growth signifies an 80.49% increase over the last five years, with the platform’s growth rate hitting a 5.13 multiple.
The user demographic leans more towards male users at 67%, with a considerable 69.96% of access coming from mobile devices, indicating a strong preference for on-the-go video consumption. Where else are you going to get the latest movie trailers or updates from your favourite visual content creators?
Here are some key numbers:
- Total Visits 2023: 1.35T
- % of Total Visits of the Top 10 Sites: 68.17%
- Average Monthly Visits in 2023: 112.5B
- Average Daily Visits in 2023: 3.7B
- Growth (2019-2023): 1.09T (80.49%)
- Average Visit Duration in 2023: 30:25
- Gender Distribution: 67% Male, 33% Female
- Device Preference: 69.96% Mobile
2) Facebook
Facebook, which once held the crown for the most visited site, has seen a more modest growth, standing as the second most visited platform in 2023 with 216.4 billion visits. From its 2019 visits count of 183.2 billion, the platform has grown by 15.33%, a more restrained but still impressive pace with a growth rate of 1.18 times.
The platform has a fairly balanced user base with 66% male and 34% female users, and it has an almost even split between desktop and mobile usage. As a platform for social connection, Facebook is still leading the charge on that front, making it a great idea to use an FB widget to extend that connection to your website as well.
Here are some key numbers:
- Total Visits 2023: 216.4B
- % of Total Visits of the Top 10 Sites: 10.93%
- Average Monthly Visits in 2023: 18.0B
- Average Daily Visits in 2023: 592.7M
- Growth (2019-2023): 33.2B (15.33%)
- Average Visit Duration in 2023: 21:09
- Gender Distribution: 66% Male, 34% Female
- Device Preference: 49.72% Mobile
3) X (Twitter)
X (Twitter), known for its brevity and real-time content, also shows a positive trajectory. In 2023, X garnered 112.9 billion visits, a significant jump from its 41.6 billion visits in 2019, translating to a 63.19% increase and a 2.72 multiple in growth rate.
The platform’s user base skews slightly male at 57%, and mobile usage dominates at 77.51%, reflecting the platform’s utility for timely updates on the move. People can’t get enough of those tweets.
Here are some key numbers:
- Total Visits 2023: 112.9B
- % of Total Visits of the Top 10 Sites: 5.70%
- Average Monthly Visits in 2023: 9.4B
- Average Daily Visits in 2023: 309.3M
- Growth (2019-2023): 71.3B (63.19%)
- Average Visit Duration in 2023: 15:23
- Gender Distribution: 57% Male, 43% Female
- Device Preference: 77.51% Mobile
4) Instagram
Instagram has successfully capitalized on the visual content trend, with its visits surging to 87.3 billion in 2023, a substantial growth from 32.8 billion in 2019. This translates to a 62.40% increase in the last five years, with a growth rate of 2.66 times. If it keeps going this way it may bump itself up a spot or two.
The platform’s user base is evenly split with 67% male and 33% female, and it’s predominantly accessed via mobile devices at 58.05%, underscoring its popularity as a mobile-first platform that offers a lot of visual entertainment perks.
Here are some key numbers:
- Total Visits 2023: 87.3B
- % of Total Visits of the Top 10 Sites: 4.41%
- Average Monthly Visits in 2023: 7.3B
- Average Daily Visits in 2023: 239.0M
- Growth (2019-2023): 54.4B (62.40%)
- Average Visit Duration in 2023: 16:32
- Gender Distribution: 67% Male, 33% Female
- Device Preference: 58.05% Mobile
5) Reddit
Reddit has entered the battlefield as a cornerstone of internet culture, boasting 81.0 billion visits in 2023, up from 25.3 billion in 2019. This represents a 68.72% increase, tripling its footprint with a growth rate of 3.20 times that I’m sure it will only improve on each year.
The platform’s user demographic is slightly more male at 69%, and it enjoys a healthy 72.27% of its traffic coming from mobile devices, highlighting the community-driven nature of content consumption.
Here are some key numbers:
- Total Visits 2023: 81.0B
- % of Total Visits of the Top 10 Sites: 4.09%
- Average Monthly Visits in 2023: 6.8B
- Average Daily Visits in 2023: 221.9M
- Growth (2019-2023): 55.7B (68.72%)
- Average Visit Duration in 2023: 11:30
- Gender Distribution: 69% Male, 31% Female
- Device Preference: 72.27% Mobile
6) TikTok
TikTok, the breakout star in the social media space, has seen an explosive 60.15 times increase in its growth rate, the highest among the top platforms. From just 0.7 billion visits in 2019, the platform has skyrocketed to 41.8 billion visits in 2023. If numbers like this continue before long it might be claiming the top spot.
With an even distribution of male and female users at 69% and 31%, respectively, TikTok has made a remarkable 78.35% of its access from mobile devices, reflecting its status as a mobile-centric platform. And in an increasingly mobile-centric world the odds are very much in TikTok’s favour.
Here are some key numbers:
- Total Visits 2023: 41.8B
- % of Total Visits of the Top 10 Sites: 2.11%
- Average Monthly Visits in 2023: 3.5B
- Average Daily Visits in 2023: 114.7M
- Growth (2019-2023): 41.2B (98.34%)
- Average Visit Duration in 2023: 9:34
- Gender Distribution: 69% Male, 31% Female
- Device Preference: 78.35% Mobile
7) WhatsApp
WhatsApp, as a messaging giant, has also witnessed a significant uptick in visits, with 31.3 billion in 2023 compared to 9.8 billion in 2019, marking a 68.72% increase and a 3.20 times growth in visits.
The platform is predominantly used by male users at 81%, with a surprisingly high number of desktop users at 64.37%, suggesting its widespread use as a cross-platform communication tool.
Here are some key numbers:
- Total Visits 2023: 31.3B
- % of Total Visits of the Top 10 Sites: 1.58%
- Average Monthly Visits in 2023: 2.6B
- Average Daily Visits in 2023: 85.6M
- Growth (2019-2023): 21.5B (68.72%)
- Average Visit Duration in 2023: 14:48
- Gender Distribution: 81% Male, 19% Female
- Device Preference: 35.79% Mobile
8) LinkedIn
LinkedIn, the professional networking site, continues to grow steadily, reaching 20.5 billion visits in 2023 from 8.3 billion in 2019. This is a 59.41% increase in visits, with a 2.46 times growth rate, and shows how the business sector is quickly moving to online resources for connection and outreach.
The platform has a user base with a male majority of 68%, and it is primarily accessed through desktop devices at 67.73%, which aligns with its professional context where users are likely to engage during work hours on their workstations. A slightly more formal but just as important platform.
Here are some key numbers:
- Total Visits 2023: 20.5B
- % of Total Visits of the Top 10 Sites: 1.04%
- Average Monthly Visits in 2023: 1.7B
- Average Daily Visits in 2023: 56.2M
- Growth (2019-2023): 12.2B (59.41%)
- Average Visit Duration in 2023: 12:25
- Gender Distribution: 68% Male, 32% Female
- Device Preference: 32.56% Mobile
9) Twitch
Twitch, the live streaming platform primarily for gamers, has seen its visits almost double from 10.4 billion in 2019 to 20.0 billion in 2023. This growth marks a 48.14% increase, with a growth rate of 1.93 times.
Twitch has a user base comprising 75% male users, reflecting the gaming community’s clear demographics. However, it has a significant 43.43% of users accessing the platform from mobile devices, indicating the rise of mobile gaming and live streaming viewership.
Here are some key numbers:
- Total Visits 2023: 20.0B
- % of Total Visits of the Top 10 Sites: 1.01%
- Average Monthly Visits in 2023: 1.7B
- Average Daily Visits in 2023: 54.8M
- Growth (2019-2023): 9.6B (48.14%)
- Average Visit Duration in 2023: 20:05
- Gender Distribution: 75% Male, 25% Female
- Device Preference: 43.43% Mobile
10) Quora
Quora, the question-and-answer platform, has also experienced notable growth, with visits climbing to 19.0 billion in 2023 from 7.6 billion in 2019, a 60.25% increase and a 2.52 times growth rate.
The user base is slightly more male-dominated at 67.5%, with a substantial 73.37% of the visits coming from mobile devices, pointing to the growing trend of seeking and sharing knowledge on the go and at a fast pace.
Here are some key numbers:
- Total Visits 2023: 19.0B
- % of Total Visits of the Top 10 Sites: 0.96%
- Average Monthly Visits in 2023: 1.6B
- Average Daily Visits in 2023: 52.1M
- Growth (2019-2023): 11.4B (60.25%)
- Average Visit Duration in 2023: 9:37
- Gender Distribution: 67.5% Male, 32.5% Female
- Device Preference: 73.37% Mobile
Top 10 Countries With the Most Social Media Visits, 2023
In 2023, the global social media landscape saw varying levels of engagement across different countries, but unsurprisingly all showed significant growth. The data presents an intriguing look at the top 10 countries with the most social media visits, offering insights into the digital behavior patterns prevalent in each nation.
Top 10 Countries With the Most Social Media Visits_ 2023
1) United States
Topping the chart, the United States (unsurprisingly) accounted for a striking 22.03% of the total social media visits worldwide, with a whopping 436.1 billion visits overall. With a population of 341.3 million, this amounts to an average of 1279.08 visits per person per year, showcasing the deeply integrated role of social media in American daily life.
2) India
Following the US, India registered 171.8 billion social media visits, which is 8.68% of the global total. Given its large population of 1435.7 million, the visits per person stand at 119.67 per year, indicating a growing digital footprint in the country’s expanding internet user base that will only continue to grow with each passing year.
3) Brazil
In Brazil, there were 123 billion visits, making up 6.21% of the total. With a population of 217.1 million, the visit rate is 566.64 per person per year, reflecting a high level of engagement in social media among Brazilians. Seemingly, YouTube has charmed every corner of the world.
4) Japan
Japan’s 88.1 billion visits represent 4.45% of the total, with an impressive 714.61 visits per person per year from its 123.3 million population. This high per capita rate underscores the prominence of social media in Japanese culture.
5) United Kingdom
The UK stands at 71.6 billion visits, 3.62% of the global share. With a smaller population of 67.7 million, the UK’s visits per person per year is a significant 1057.28, suggesting a highly active social media environment with youngsters no doubt being glued to their phones.
6) Indonesia
Indonesia’s social media visits reached 71.5 billion, close to the UK’s total and accounting for 3.61% of the world’s visits. The per-person rate is 257.49 visits per year among its 277.5 million population, indicative of its rapidly growing digital presence. But then, which countries aren’t joining the social media gang?
7) Turkey
Turkey contributed 63.3 billion visits, which is 3.18% of the global visits. With a population of 85.8 million, the visit rate is 733.93 visits per person per year, pointing to a strong engagement with social media platforms.
8) Germany
German users visited social media platforms 57.9 billion times, comprising 2.92% of the total visits in 2023. With a population of 83.3 million, the visits per person per year in Germany are 694.88, showing robust use of social media.
9) Thailand
With 53.1 billion visits, Thailand accounts for 2.68% of the total, and with a population of 71.8 million, it has a visit rate of 739.29 visits per person per year, highlighting a significant integration of social media into daily life.
10) Mexico
Rounding out the top 10, Mexico saw 50.8 billion social media visits, or 2.56% of the global total. With a population of 128.5 million, the visits per person per year are 395.21, reflecting a growing engagement with social media in the country.
The data reveals a diverse range of social media interaction across these countries, with the United States leading by a substantial margin in both total visits and visits per capita. Social media junkies, we’ll call them.
Notably, countries with smaller populations like the UK and Germany show a high number of visits per person, indicating a possible higher penetration and reliance on social media in these populations.
Conversely, India’s massive population contributes to a lower per capita visit count, yet its sheer volume signifies an expanding digital space. These figures illustrate not only the global reach of social media but also the varying degrees of its impact on different societies.
Social Media Usage by Gender, Device, and Usage Duration, 2023
Gender Distribution:
On average, social media platforms see a male user majority at 68.65% compared to 31.35% female users. WhatsApp diverges from this pattern with a significantly higher male user base at 81%. LinkedIn and Twitch also show a higher male dominance at 68% and 75%, respectively.
Social Media Visits by Gender
This suggests that certain platforms may cater more to male interests or be more aligned with male-dominated industries, such as LinkedIn with the professional and business sectors. Conversely, Twitter exhibits a more balanced gender distribution with 57% male and 43% female users, indicating a more evenly distributed and universal appeal.
Device Preference:
Mobile devices dominate as the primary means of accessing social media (gone are the days where their primary use was for calls), with an average of 59.10% of total visits across all platforms. This trend is most pronounced on TikTok, where a staggering 78.35% of usage comes from mobile devices. Similarly, platforms like YouTube, Facebook, and Reddit also see more than 70% of their traffic from mobile.
Social Media Visits by Device
This mobile preference underscores the global shift towards smartphones as the go-to device for social media, emphasizing the importance of mobile-friendly content and interfaces. Safe to say, if it’s not accessible on mobile, or optimized through effective social media management, it won’t garner much interest.
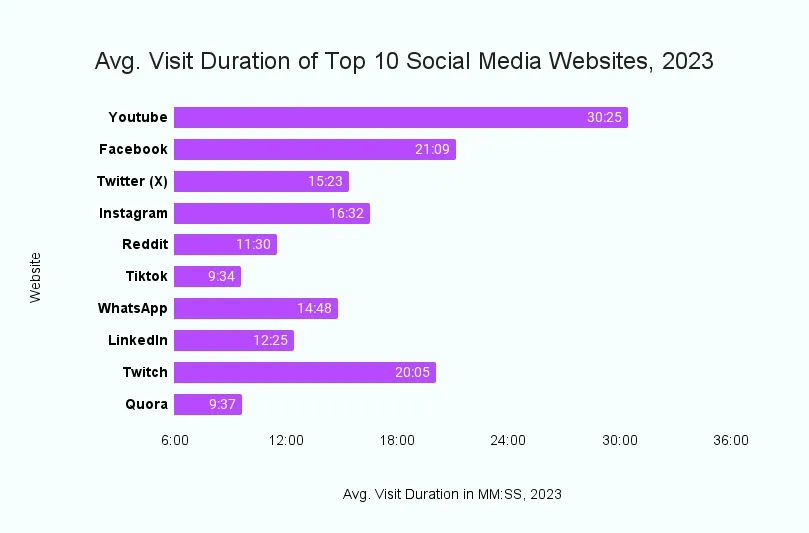
Visit Duration (mm:ss):
In 2023, the average visit duration on top social media platforms varied, reflecting diverse content consumption habits, no two people are the same. YouTube led with an average stay of 30:25, indicating long-form content engagement. Facebook and Twitch users also spent considerable time, with 21:09 and 20:05 respectively, while TikTok and Quora registered shorter sessions, around 9:34 and 9:37.
Avg. Visit Duration of Top 10 Social Media Websites_ 2023
The overall average duration across these platforms was 16:09, suggesting a balanced mix of brief and extended interactions.
Methodology
Study Objectives and Relevance
The crux of our methodology was to unravel the complex dynamics of social media usage. By analyzing trends, user demographics, country-specific engagement, and platform growth, our study aimed to offer comprehensive insights into the shifting landscape of social media.
Data Collection and Initial Analysis
We initiated our study by cataloging all accessible social media platforms available on the internet. Using SEMrush, a cutting-edge SEO and analytics tool, we meticulously tracked the annual visits to these sites.
This initial sweep allowed us to pinpoint the top ten most visited social media websites of 2023. We then set out to chart the growth trajectories and user engagement patterns on these platforms over a defined period, from 2019 to 2023, capturing their combined annual traffic and quantifying the overall growth in visits.
Demographic and Geographic Insights
Our research extended into demographic analysis, assessing gender distribution and device preference among users. We integrated the latest population data to calculate the average social media visits per person per year, thus identifying which countries are the most active on social media.
This facet of the study also sheds light on regions with large populations but comparatively lower social media activity, indicating areas with potential for digital growth and increased internet engagement.
The conclusions drawn are tailored to equip social media strategists, marketers, and policymakers with actionable data to capitalize on the trends identified for 2024 and beyond.
You may also like
Essential resources for your success
